
How Europe Lost Competitiveness: The Hard Fate of a Hostage to Geopolitics

HIIA Analysis – Written by Ruslan Bortnik & Máté Kováts
In this analysis, we investigate how Europe’s abrupt loss of access to relatively cheap energy sources reshaped the continent’s economic fundamentals, not as a one-off “price shock,” but as a structural competitiveness problem that ripples through trade, industry, investment, and public finances. We map the scale and mechanics of the energy shock that unfolded in 2022–2025: the surge in benchmark gas and power prices, the widening gap between European industrial tariffs and those of key competitors, and the forced substitution of long-established supply patterns with costlier alternatives such as spot liquefied natural gas (LNG). We then connect energy costs to macroeconomic outcomes, including the deterioration of the external balance and the inflationary wave that pressured monetary policy, tightened financing conditions, and reduced the room for productive investment. On the real-economy level, we trace how elevated energy and input prices translated into lost output and shrinking margins in energy-intensive sectors such as metallurgy, chemicals, and fertilizers, while also spilling over into downstream manufacturing (including in the automotive and machinery sectors) via higher materials costs, disrupted supplier networks, and weaker export price competitiveness. To move beyond a qualitative diagnosis, we assemble and calculate the main channels of economic damage from 2022 to 2025: additional energy import costs, fiscal outlays for emergency support measures, trade losses linked to the contraction of EU–Russia commerce, industrial underperformance, and GDP shortfalls relative to pre-crisis trajectories. Finally, we assess the durability of Europe’s current “adaptation” and outline forward-looking risks, including the potential for renewed instability as further policy decisions on the phase-out of remaining Russian energy flows interact with broader restrictive regimes and a tighter global market for hydrocarbons and LNG.
The PDF version is available here!

The Structural Challenge to Europe’s Industrial Model
From 2022 to 2025, Europe faced an unprecedented energy crisis. The sharp rise in gas and electricity prices caused by reduced supplies from Russia and sanctions policy has seriously hit European industry. As a result, wholesale gas and electricity prices have reached record highs, which has led to a jump in costs for producers and forced many enterprises to reduce energy consumption or stop production altogether.[1] By Q3 of 2021, the EU’s trade deficit started to rise sharply due to the rise in the cost of energy imports—the first deficit recorded in decades.[2] European industry, especially energy-intensive sectors, lost its former competitiveness: High energy tariffs significantly exceeded levels in other regions and pushed producers to move capacities outside of Europe.
Energy Crisis as a Turning Point
Price Shock in Gas and Electricity Markets
Energy markets in Europe experienced a real shock after the start of the war in Ukraine. Back in 2019–2020, wholesale natural gas prices fluctuated around €15–20 per megawatt-hour. They began to rise in the second half of 2021, accelerating after the start of the war in Ukraine in February 2022. By August of that year, the Dutch TTF hub, the benchmark for the European gas market, reached more than €340 per megawatt-hour, an all-time high.[3] In other words, gas prices on the European market rose tenfold compared to pre-crisis levels.[4] In the beginning of 2023, prices rolled back to around €50 per megawatt-hour, much lower than the peak but still higher than the historic average.
Similar dynamics unfolded on the electricity market. Wholesale electricity prices in EU countries were already elevated in the first half of 2022, around €180 per megawatt-hour in May. By the middle of the year, they reached a record €220 per megawatt-hour.[5] In some cases, extreme spikes were recorded in short-term markets. In Germany, for example, at the end of 2022, instant exchange prices reached almost €1,000 per megawatt-hour.[6] There was a significant rise in prices for industrial consumers, although this increase was partially mitigated by government support measures. According to the European Commission, even after the decline in exchange prices in 2024, retail energy prices for enterprises remain significantly above pre-crisis levels at around €150–199 per megawatt-hour.[7] In comparison, in 2021, the price was a mere €100 per megawatt-hour.[8]
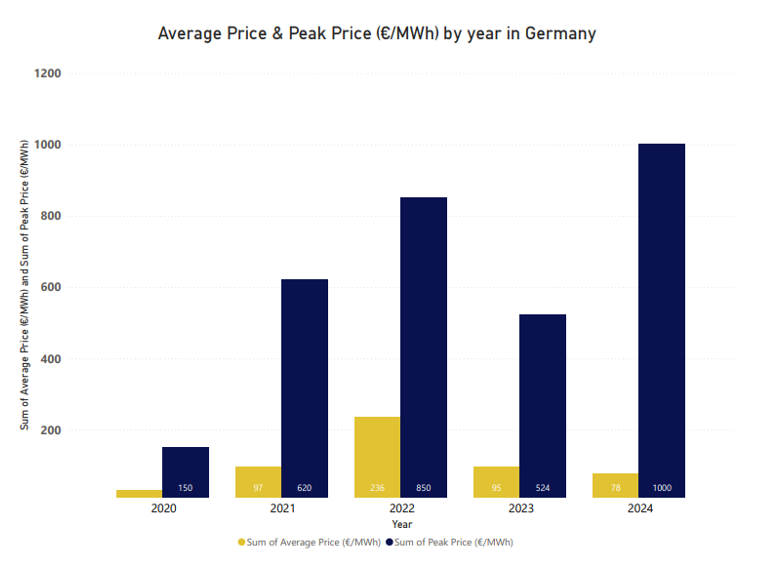
Figure 1. Industrial Electricity Prices in the EU-27, USA, UK, Japan, Canada, and South Korea (EUR2023/MWh). Visualization by the authors using data from Statista.
Europe’s Energy Costs Relative to Global Prices
In 2024, the industrial electricity price in Europe was on average about two times higher than in the United States (€150 per megawatt-hour compared to €75 per megawatt-hour in the United States) and 80 percent higher than in China (€82 per megawatt-hour).[9] The gap is even more noticeable when looking at gas prices: The price of gas for industry in the United States is less than a quarter of the European price—in other words, European gas is more than four times more expensive.[10] In 2023, gas for industry cost almost twice as much as prior to 2021, and gas and electricity prices for European factories were still two to four times higher than those of factories in the EU’s main trading partners.[11]
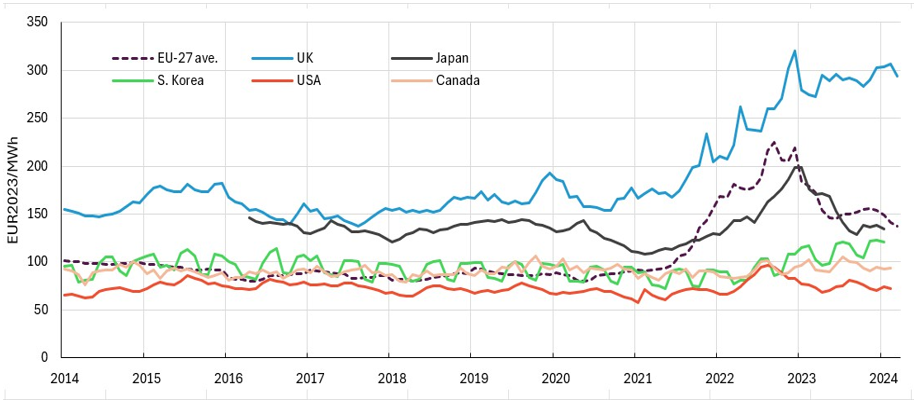
Figure 2. Industrial End-User (I5 Band) Natural Gas Prices in the EU and Its Major Trading Partners. Source: Trinomics et al. (2024), based on data from S&P Platts, Eurostat, Enerdata EnerMonthly.
Prices for medium-sized industrial gas consumers have almost doubled from €40 per megawatt-hour in 2021 to €76 per megawatt-hour in 2023.[12] In 2024, prices rolled back to €50 per megawatt-hour. At the same time, in the United States and Canada, prices in 2024 were only around €20 per megawatt-hour. At the end of 2024, the industrial price of natural gas in China was in the range of 4.2–4.5 renminbi per cubed meter, the equivalent of around €50–58 per megawatt-hour.[13] This was almost 40 percent cheaper than industrial gas in the EU for 2023, which was around €76 per megawatt-hour. China was able to benefit from European sanctions on Russian energy, since Beijing managed to import Russian energy at prices lower than the market price due to differences between Russian oil and gas prices and others around the world.
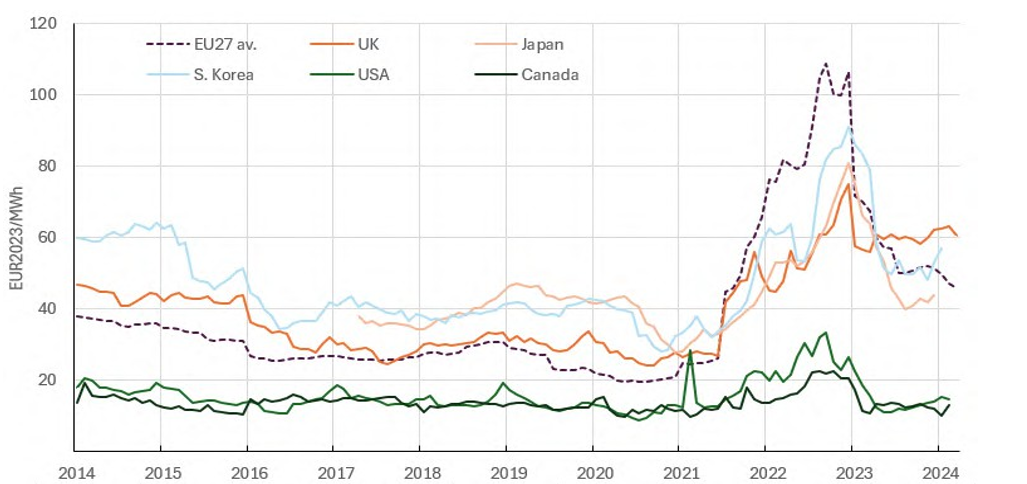
Figure 3. Industrial Electricity Prices in the EU-27, USA, UK, Japan, Canada, and South Korea (EUR2023/MWh). Source: Trinomics et al. (2024), based on data from Eurostat, Enerdata EnerMonthly.
The Geopolitical Disruption of Europe’s Energy Supply
The main trigger of the energy crisis was the war in Ukraine and the subsequent severance of Europe’s long-standing energy ties with Russia. Until 2022, the Russian Federation was the largest supplier of natural gas to the EU, providing about 40 percent of gas imports.[14] In addition to gas, a significant share of imports was comprised by supplies of Russian oil, petroleum products, coal and nuclear fuel. After February 2022, the situation changed radically: The European Union gradually imposed sanctions on coal imports starting in August 2022 and banned maritime supplies of Russian oil starting in December 2022, allowing only limited exemptions for pipeline oil to Central Europe.[15] However, the gas prices in Europe had already started to rise after the Q2 of 2021. In particular, the supply of crude oil through the Druzhba pipeline for Hungary and Slovakia fell under the sanctions exceptions—these countries continue to receive Russian oil via pipeline on the basis of special clauses with no fixed end date. At the same time, in February 2023, an embargo on the import of Russian petroleum products came into effect, with a limited deferred exception for vacuum gas oil in Croatia until the end of 2025. Russian pipeline gas exports to the EU fell by almost 88 percent.[16] As a result, Russia’s share in European gas consumption collapsed from around 40 percent in 2021 by up to 10–12 percent between 2022 and 2025.[17] Critics pointed out that multiple European countries managed to circumvent sanctions through the shadow fleet system—these states kept importing Russian energy without the official additament of it. Later, the European Union reacted to this tendency by banning the “use” of the shadow fleet for EU member states.
After the start of the war in Ukraine in February 2022 and the imposition of sanctions against the Russian Federation, Europe was forced to hastily reorient itself to other sources. Imports of LNG increased sharply: LNG terminals worked at the limit, attracting cargo from the United States, Qatar, and Africa. However, this decision had a price—spot LNG is much more expensive than long-term Russian pipeline gas. Europe’s total bill for energy imports soared to €604 billion in 2022, a record burden on the economy.[18] According to the International Energy Agency, the EU paid about €400 billion for gas alone in 2022, which is more than three times the amount in 2021.[19]
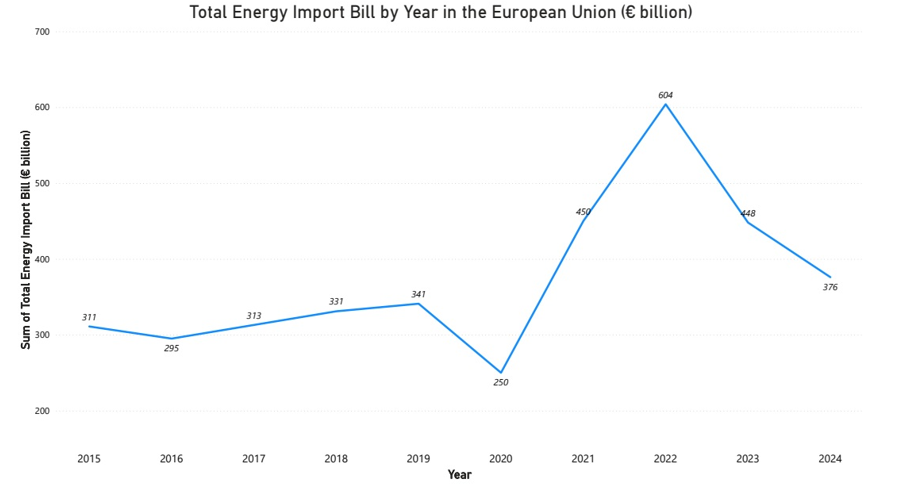
Figure 4. Total Energy Import Bill by Year in the European Union. Visualization by the authors using data from the European Commission.[20]
This sharp outflow of fuel funds led to the largest one-time deterioration in the eurozone’s trade balance in history: In 2021, the current account was in the black by 2.8 percent of GDP, while in 2022 there was a deficit of about 0.8 percent of GDP. The EU’s energy trade balance shifted from a surplus to a deficit, with the energy deficit alone reaching about four percent of GDP in 2022, compared to 1.9 percent a year earlier.[21] This “leakage” of wealth from the EU is equivalent to hundreds of billions of euros overpaid for expensive gas and oil imports and effectively means a decrease in the competitiveness of the economy.
Economic Transmission Channels of the Energy Shock
Industrial Output and Sectoral Impacts
High prices in Europe stand in stark contrast to prices in other major economies and are at the root of its competitiveness problems. Industrial consumers in the EU pay much more for energy than their counterparts in the United States, China, and the Middle East. Even by 2025, industrial gas in the United States costs less than a quarter of the price in the EU.[22] China relies more on coal for energy, but in general, its energy is also cheaper than in Europe, creating incentives for the transfer of energy-intensive industries to where energy is cheaper.[23] The gap in energy prices has led to a direct loss of market share for Europe. For example, energy-intensive products that used to be produced within the EU are increasingly being imported from countries with lower tariffs. The energy shock hit energy-intensive industries the hardest: metallurgy, chemicals and fertilizers, as well as mechanical engineering. In these industries, the share of costs for fuel, electricity, and gas is especially large. In 2022 and early 2023, such industries experienced a particularly acute wave of production declines, temporary shutdowns, and even complete plant closures. The European Central Bank notes that imports of energy-rich goods to the EU increased markedly in 2022, as domestic products became less competitive due to a disproportionate jump in energy prices.[24] Overall, the energy shock reduced eurozone industrial production by about two percent over the course of the year.[25]
The automotive and mechanical engineering sectors, although less energy intensive, were nevertheless indirectly affected. First, the rise in the price of steel, aluminum, plastics, and chemical components (paints and varnishes, tires, etc.) increased the cost of final products. Second, some car factories faced interruptions in the supply of components from closed European suppliers—for example, shortages of magnesium castings and aluminum parts. Third, the cost of electricity for the auto companies themselves (for factories, paint shops, etc.) also increased, although not as dramatically as in the chemical sector.
The effect of expensive energy was also felt in mechanical engineering.[26] According to a survey by the Union of German Chambers of Industry and Commerce, one in six companies in the automotive sector (16 percent) was forced to reduce production due to energy tariffs. This is an alarming signal: The automotive industry has historically been the core of European industry, especially in Germany, France, Italy, and Spain. Even if the industry is considering relocation, this means that the problem is systemic. The consequence of the difference in prices was the redirection of investments. Foreign investors, as well as European corporations themselves, are increasingly refraining from launching new energy-intensive projects in the EU, preferring to invest where energy is cheaper and supply is more stable. The inflow of foreign direct investment (FDI) into the industrial sector fell sharply: while foreign investment was measured in billions of euros in the first half of 2022, by the first half of 2025, it had fallen to a few hundred million euros. The EU’s share of global FDI flows fell from 34 percent in early 2022 to only 10 percent by mid-2025.[27] At the same time, China expanded its investment activity and assumed the leading position, while Europe lost its attractiveness to capital. Of course, other factors including regulation and market prospects also influenced investors’ decisions, but the energy factor has emerged as a decisive one: Unless it reduces the cost of energy, Europe will not be able to compete for large industrial projects.
Policy Responses and Their Trade-Offs
Despite the sanctions course, Europe was forced to make some exceptions in order to avoid the collapse of certain sectors. In addition to exceptions for pipeline oil in Central Europe, loopholes in gas imports also remain.[28] Although pipeline gas from Russia has decreased to a minimum, imports of Russian LNG have not been banned under the sanctions regime and even increased. Thus, in 2023, the volume of LNG purchases from the Russian Federation by Europeans was around 40 percent higher than in 2021. Spain and Belgium became the second and third largest buyers of Russian LNG in the world after China—they accounted for 18 percent and 17 percent of all Russian supplies, respectively, in the first half of 2023.[29] This means that some EU countries have increased purchases of Russian gas in liquefied form, despite officially announcing their intention to phase it out—in energy-equivalent terms, the purchases represent close to 13 billion cubic meters of gas. For comparison, 62 billion cubic meters came from Russia through pipelines in 2022, and about 140 billion cubic meters came each year before the war.[30] Thus, LNG has only partially replaced the lost volume, but its importance has increased. Politically, the EU is seeking to reduce these supplies as well: By the end of 2025, a complete ban on Russian LNG imports was being discussed, but until such measures are introduced, countries continue to buy Russian LNG for commercial reasons. Enriched uranium and nuclear fuel from the Russian Federation are also exempt from sanctions, since 19 reactors that depend on fuel supplies from the Russian Federation operate in the EU—in Finland, Hungary, the Czech Republic, Slovakia, and Bulgaria. Although the EU also imposed restrictions against Belarus and the Russian Federation, some producers of complex fertilizers in Europe lobbied for exceptions, fearing a shortage of raw materials for the agricultural sector. As a result, as noted, fertilizer imports from these countries increased, and only after this increase did the EU decide to gradually introduce duties on fertilizers by 2028, giving the industry time to adapt.[31]
National and EU-Level Support Measures
European countries have taken steps to combat the threat of deindustrialization. In addition to general anti-crisis measures such as subsidies to consumers and price caps, targeted programs to support industry were also introduced. At the end of 2023, Germany approved an “industrial price for electricity”—the state will compensate energy-intensive enterprises for a portion of the costs in order to keep a tariff at about 6–7 cents per kilowatt-hour for them.[32] France is betting on its nuclear capacity: An agreement has been concluded with EDF under which nuclear generation will be supplied at a relatively low stable price, encouraging both households and businesses to consume more electricity without fear of price jumps. In Italy, Spain, and a number of other countries, tax burdens on electricity for industry have also been reduced, and subsidies have been allocated for technological modernization in order to save energy. These measures are designed to restore investor confidence and prevent factories from relocating abroad.
Although introducing price caps such as the previously mentioned “industrial price for electricity” supports the public and domestic industries by preventing significant increases in energy bills, it also affects the economy negatively. One of the best examples of this is the United Kingdom. Based on the Office for Budget Responsibility’s forecast report from the early 2020s, the government expected a deficit of approximately £190 billion between 2022 and 2024. The actual deficit turned out to be £410 billion. The difference between the predicted and actual deficit was due to multiple factors, one of which was the high compensation fee that the government paid for the Energy Price Guarantee (EPG) during this period. In total, around 28 percent of the unforeseen deficit was due to the EPG payoff, a significant share of the total. The European Union and its member states must be careful when using similar policies, since they can hit national economies hard and create even deeper economic disasters.
| Fiscal Year | Baseline Forecast (£ billion) | Actual PSNB Outturn (£ billion) | Overall Deficit Increase (£ billion) | Energy Support Net Cost (£ billion) | Percentage of Increase |
| 2022/23 | 83.0 | 127.0 | 44.0 | 51.1 | 116 percent |
| 2023/24 | 61.6 | 134.0 | 72.4 | 11.3 | 16 percent |
| Total | 190.9 | 411.0 | 220.1 | 62.4 | 28 percent |
Table 1. Comparison of Baseline Forecast and Actual PSNB Outturn, and the Resulting Increase in Overall Deficit and Energy Support Net Cost (2022/23–2023/24). Authors’ calculations based on data from the Office for Budget Responsibility.[33]
Implications for Europe’s Competitiveness
The combination of these factors has led to the tangible loss of competitiveness of European industry. Expensive energy resources have increased the cost of production, reduced the profitability of export-oriented industries, and narrowed the niche in which European goods can compete on price. Imports crowd out local production, where differences in energy costs outweigh other benefits.[34] While European enterprises were reducing production, their competitors in the United States, China, and the Middle East continued to work at full capacity, invest in modernization, and expand markets. In some industries, the difference is already clear. For example, in the electric vehicle sector, China increased production by more than 12.5 million units in between 2020 and 2025, five times more than the increase in the EU.[35] Of course, this is largely a product of China’s industrial policy, but energy also played a role. Cheap energy and materials allowed the Chinese to increase their competitiveness. At the same time, the European automotive industry, facing high materials and energy costs, is moving more slowly. Some European battery manufacturers and electrochemical companies are considering moving to the United States, attracted by generous subsidies from the American Inflation Reduction Act and low gas prices. Such an outcome threatens to outflow innovations from the EU. This creates the risk of the deindustrialization of Europe. Although the complete disappearance of industry in the EU is unlikely, there has been a relative reduction in its focus and a shift in emphasis towards less energy-intensive and high-tech areas. Europe risks turning into a “lighter” economy, losing part of heavy industry and related value chains. The loss of competitiveness is also manifested quantitatively: The EU’s share in global industrial production is gradually declining, European companies are less likely to be among the largest investors in new plants, and Europeans themselves are increasingly investing abroad rather than at home.[36]
Aggregate Economic Costs of the Energy Shock
Over the 2021–2025 period, the sanctions policy against Russia and ensuing energy gap cost Europe (including the United Kingdom) astronomical sums—the total account is trillions of euros. These losses consist of several components: direct trade losses from a dramatic reduction in exports and imports, energy costs resulting from the sharp rise in prices and the replacement of Russian energy resources with more expensive ones, a slowdown in economic growth due to lost GDP, corporate losses including asset write-offs when exiting Russia and lost contracts, as well as other large-scale budget losses as part of crisis mitigation. All significant indicators are confirmed by the latest available data at the end of 2025.
It is possible to conditionally decompose the total losses of Europe from the 2021–2025 sanctions policy into five key components:
- Energy sector: Almost all previous volumes of inexpensive Russian gas, oil, and coal have been lost. The additional costs of energy imports in 2022–2023 are estimated at hundreds of billions of euros. For example, the deterioration of the eurozone’s trade balance by about 3.6 percent of GDP in 2022 alone amounts to around a €400 billion loss.[37] The official Eurostat analysis estimates the additional costs of fossil energy imports in 2022–2024 at about €600 billion compared to 2021 levels.[38] Taking into account the fact that in 2025 the EU’s energy import fee remained significantly higher than before the crisis, the total additional costs for 2022–2025 can be roughly estimated in the range of €650–850 billion. States also spent around €800 billion on price compensation.[39] According to the Brussels-based think tank Bruegel, the total amount of fiscal support measures from the beginning of the energy crisis in the autumn of 2021 to the beginning of 2023 reached about €800 billion, including about €681 billion in the EU countries and €103 billion in the UK.[40] This amount is comparable to the scale of the EU recovery fund after the COVID-19 pandemic. The International Monetary Fund noted that if governments fully covered the increase in energy prices for consumers in 2022, the bill could easily reach one trillion euros, around six percent of the EU’s annual GDP.[41] Although only part of this amount was ultimately subsidized, states suffered a colossal burden on budgets, weakening their opportunities for other investments. According to a report by the European Commission, energy subsidies increased from €213 billion in 2021 to about €354 billion in 2023.[42] If we take into account that the measures in 2024 and 2025 remained significant, though slightly reduced, then the approximate amount of budget expenditures and consumer support for the 2022–2025 period can be estimated at €0.9–1.2 trillion. That is, in total, the energy crisis “ate up” about €1.5–2 trillion in various forms (direct costs, currency outflow, income losses).
- Foreign trade: Europe’s exports lost access to the Russian market relative to 2021, with mechanical engineering, the automotive industry, and consumer goods especially affected.[43] Total EU exports to Russia in 2024 amounted to €31.5 billion, compared to €99 billion in 2021. The bulk of exports were chemicals (€13.7 billion), food and raw materials (€5.9 billion), as well as machinery and transport equipment (€4.1 billion). Exports to the Russian Federation fell to just €55 billion in 2022 and in €38 billion in 2023. Europe lost about €170 billion in export profits over the course of 2022–2024.
- Imports from Russia decreased even more (at a rate of €122 billion per year) and were partially replaced by more expensive imports, which also amounted to a loss.[44] In general, trade losses can be estimated at upwards of €300 billion. In addition, Moscow’s countermeasures, such as the ban on the export of certain goods and reduction in gas supplies from the summer of 2022, disrupted supply chains and caused shortages of metals, fertilizers, wood, nuclear fuel, titanium, etc. All this was reflected in the rise in prices and production costs in the EU.
- Industry and business: The investment climate in Europe deteriorated due to high energy costs, with some new projects going to the United States and Asia. Energy-intensive industries in the EU have suffered production losses—including a decline around 5–10 percent in 2022—and many enterprises reduced output or temporarily closed.[45] New opportunities were missed as major deals were canceled—European automakers lost a lucrative market worth about €15 billion per year by leaving the Russian Federation. According to Eurostat, EU industrial production slowed sharply after growing 8.5 percent in 2021,[46] showing minimal growth of 0.3–0.4 percent in 2022 and a contraction of 1.2 percent in 2023, amounting to a total loss of €9.8 trillion.[47] Taking this into account, the base turnover indicator for 2021 was about €9.8 trillion. This was followed by a decline of 1.2 percent in 2023 and further stagnation in 2024–2025, which reduced the manufacturing sector’s turnover to approximately €9.38–9.43 trillion in 2025.
- GDP and macroeconomics: In total, between 2022 and 2024, the European Union lost between €400 and €800 billion in GDP compared to pre-crisis trends (the difference between pre-war growth forecasts and the actual trajectory). In 2022 prices, this is about 2–4 percent of the EU’s total GDP. EU economic growth in 2023–2024 stalled due to high energy prices and the need to tighten monetary policy to fight inflation. GDP growth was -6.3 percent in 2021, 3.5 percent in 2022, 0.5 percent in 2023, and one percent in 2024.[48]
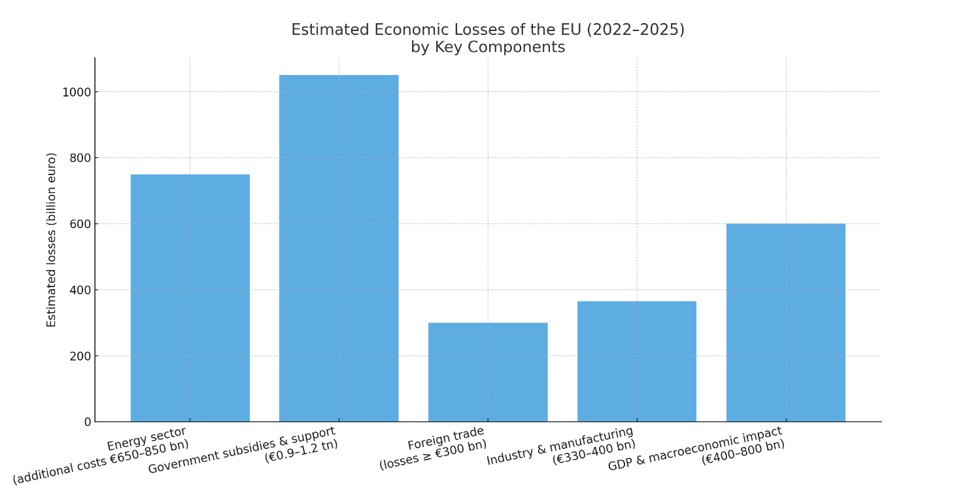
Figure 5. Summary of Estimated Economic Losses for the EU (2022–2025), by Key Component. Visualization by the authors.
In addition, the acceleration of inflation to double-digit levels led to increased interest rates—the ECB raised rates to four percent in 2023—which increases the cost of borrowing and will slow down investment in the coming years. This too means a long-term loss of growth potential. In terms of trade balance and exchange rate, a sharp increase in energy imports led to a current account deficit.[49] This put pressure on the euro, which in 2022 fell to parity with the dollar, which supported exports somewhat but made imports even more expensive, especially in microchips and electronics, driving up inflation and adding to the list of problems facing European production.
Strategic Options for Europe’s Industrial and Energy Policy
The European economy has partially adapted to the new conditions, but at a significant cost. Europe managed to avoid a potentially catastrophic scenario in the winter of 2022–2023: Gas storage facilities were full, and a roughly 20 percent reduction in demand prevented fuel shortages.[50] In 2023–2024, prices stabilized below peak values, inflation began to decline, and industry began to recover little by little. EU countries accelerated the push for energy efficiency and the transition to alternative sources of energy like renewables to reduce dependence. Renewable energy investments in Europe in 2023 exceeded €110 billion.[51] Although global supply chains are being restructured, the long-term effects of the sanctions policy will be felt for a long time to come. The EU’s foreign trade with Russia is at a historically low level, energy from the Russian Federation has been almost completely replaced,[52] but the alternatives have turned out to be more expensive—which is manifested in record costs for the import of LNG and other fuels.[53]
The energy shock resulting from sanctions was the largest test for Europe since the oil crisis, significantly weakening its economy and slowing growth to just one percent in 2024.[54] The total losses of the EU and the UK from the sanctions policy are in the hundreds of billions when looking at trade losses and lost GDP. Taking into account the indirect effects as well, the total economic losses for Europe between 2022 and 2025 may be in the range of about €2.2–2.7 trillion. The beneficiaries of this situation were the countries that took the place of the Russian Federation in the European market or gained access to cheap Russian resources—primarily the United States and China, which strengthened their positions against the backdrop of Europe’s difficulties.[55]
Adapting to the new conditions proved costly and structurally painful. Industrial competitiveness was undermined, while the “insurance policy” of budget compensation schemes and price caps simultaneously kept production afloat and inflated fiscal risks. In the real economy, this has translated into accelerating deindustrialization, the relocation of parts of energy-intensive value chains outside the EU, and a weakening of Europe’s investment appeal amid a persistent gap in gas and electricity costs compared with the United States and a number of Asian economies.
The current equilibrium is not sustainable. It rests on expensive supplies to replace lost Russian inflows, expanded LNG infrastructure, and policies of managed demand rather than on restoring energy costs comparable to those of key competitors. The EU’s trade-and-energy balance has already undergone a historic shift; even if exchange prices normalize, end-user tariffs for industry continue to function as a “tax” on production, eroding export capacity and reinforcing the substitution of European output with imports from regions where energy and raw materials are cheaper.
In 2026–2027, the situation may deteriorate further due to new European Commission decisions aimed at an additional phase-out of Russian energy supplies, as well as the expansion of restrictive regimes toward Iran and Venezuela. Taken together, this increases the likelihood of renewed price volatility, a higher risk premium in energy supply, and intensified competition for global LNG volumes, which would be particularly painful for European industry and households. Politically, it creates conditions for socio-economic and, consequently, socio-political turbulence: rising living costs, pressure on public budgets, disputes over the distribution of compensations, and a heightened potential for protests.
Europe has entered a phase in which the price of geopolitical decisions is expressed not only through one-off shocks, but also through a long-term loss of growth momentum, a deterioration of competitiveness, and an outflow of capital and technology. Under this logic, the winners are those who either replaced Russia in the European market or gained access to cheaper Russian resources and leveraged Europe’s price differential as a competitive advantage—above all, the United States and China. This entrenches an asymmetry: Europe pays for the transition, while its competitors convert it into an expanded industrial base and export capacity.
Finally, our conclusions are not a call to “trade away principles.” Rather, they point to the need for a hard-nosed alignment of sanctions and foreign policy with Europe’s core interests, where competitiveness, technological development, and citizens’ welfare must take priority. Otherwise, Europe risks locking itself into the role of a “high-cost jurisdiction,” with expensive energy and capital, compensating for this through ever more burdensome subsidies, effectively financing its own relative decline. Contemporary realpolitik is pragmatic: Major powers, including the United States and China, systematically subordinate value-based rhetoric and geopolitical instruments to the task of strengthening economic power, and it is precisely this standard of effectiveness that Europe must take into account.
Endnotes
[1] Clara Denina and Sarah Mcfarlane, “Focus: Energy Crisis Chips Away at Europe’s Industrial Might,” Reuters, November 2, 2022, https://www.reuters.com/business/energy/energy-crisis-chips-away-europes-industrial-might-2022-11-02/.
[2] Lorenz Emter et al., “The Euro Area Current Account after the Pandemic and Energy Shock,” European Central Bank, September 28, 2023, https://www.ecb.europa.eu/press/economic-bulletin/articles/2023/html/ecb.ebart202306_01~4cd4215076.en.html.
[3] Ludwig Burger, “BASF Warns of Earnings Decline, Cuts Jobs in Battle against Costs,” Reuters, February 24, 2023, https://www.reuters.com/markets/europe/basf-flags-earnings-decline-job-cuts-high-costs-europe-2023-02-24/.
[4] Denina and Mcfarlane, “Focus: Energy Crisis.”
[5] “Europe’s Energy Crisis: Understanding the Drivers of the Fall in Electricity Demand – Analysis,” International Energy Agency, May 9, 2023, https://www.iea.org/commentaries/europes-energy-crisis-understanding-the-drivers-of-the-fall-in-electricity-demand.
[6] “Short-Term Power Prices Spike amid New ‘Dunkelflaute’ in Germany, Most Customers Unaffected,” Clean Energy Wire, December 13, 2024, https://www.cleanenergywire.org/news/short-term-power-prices-spike-amid-new-dunkelflaute-germany-most-customers-unaffected.
[7] “Energy Prices and Costs in Europe,” European Commission, accessed December 10, 2025, https://energy.ec.europa.eu/data-and-analysis/energy-prices-and-costs-europe_en.
[8] “High Cost of Energy,” BusinessEurope, accessed December 10, 2025, https://www.businesseurope.eu/media-room/data-hub/high-cost-of-energy/.
[9] “High Cost of Energy.”
[10] “Industry under Pressure: Europe’s Shrinking Global Role,” European Association of Automotive Suppliers, July 16, 2025, https://www.clepa.eu/insights-updates/data-digests/industry-under-pressure-europes-shrinking-global-role/.
[11] “Meeting Documents (Agendas, Minutes, Conclusions, Votes, Outcomes): 1999 to Present,” Consilium, July 23, 2025, https://www.consilium.europa.eu/en/documents/public-register/meeting-documents/.
[12] Consilium, “Meeting Documents (Agendas, Minutes, Conclusions, Votes, Outcomes).”
[13] “Usage Price: Natural Gas for Industry: Shanghai | Economic Indicators,” CEIC, accessed December 10, 2025, https://www.ceicdata.com/en/china/gas-price-36-city/cn-usage-price-natural-gas-for-industry-shanghai.
[14] Peter Zeneiwski et al., “Europe’s Energy Crisis: What Factors Drove the Record Fall in Natural Gas Demand in 2022? – Analysis,” International Energy Agency, March 14, 2023, https://www.iea.org/commentaries/europes-energy-crisis-what-factors-drove-the-record-fall-in-natural-gas-demand-in-2022.
[15] Florian Grünberger, “Which Russian Commodities Does the EU Still Import, and for How Much Longer?,” Kpler, November 11, 2025, https://www.kpler.com/blog/which-russian-commodities-does-the-eu-still-import-and-for-how-much-longer.
[16] Chuanlong Zhou et al., “Europe’s Adaptation to the Energy Crisis: Reshaped Gas Supply–Transmission–Consumption Structures and Driving Factors from 2022 to 2024,” Earth System Science Data 17, no. 7 (2025): 3431–46, https://doi.org/10.5194/essd-17-3431-2025.
[17] “EU Trade with Russia – Latest Developments,” Eurostat, accessed December 10, 2025, https://ec.europa.eu/eurostat/statistics-explained/index.php?title=EU_trade_with_Russia_-_latest_developments; Zeneiwski et al., “Europe’s Energy Crisis.”
[18] “Energy Prices and Costs in Europe.”
[19] Zeneiwski et al., “Europe’s Energy Crisis.”
[20] “Report from the Commission to the European Parliament, the Council, the European Economic and Social Committee and the Committee of the Regions,” EUR-Lex, accessed December 10, 2025, https://eur-lex.europa.eu/legal-content/EN/TXT/PDF/?uri=COM:2025:72:FIN.
[21] Emter et al., “The Euro Area Current Account.”
[22] “Industry under Pressure.”
[23] “Industry under Pressure.”
[24] Emter et al., “The Euro Area Current Account.”
[25] Francesco Chiacchio et al., “How Have Higher Energy Prices Affected Industrial Production and Imports?,” European Central Bank, February 14, 2023, https://www.ecb.europa.eu/press/economic-bulletin/focus/2023/html/ecb.ebbox202301_02~8d6f1214ae.en.html.
[26] Denina and Mcfarlane, “Focus: Energy Crisis.”
[27] “Industry under Pressure.”
[28] Grünberger, “Which Russian Commodities Does the EU Still Import.”
[29] Kate Abnett, “LNG Imports from Russia Rise, Despite Cuts in Pipeline Gas,” Reuters, August 30, 2023, https://www.reuters.com/business/energy/lng-imports-russia-rise-despite-cuts-pipeline-gas-2023-08-30/.
[30] Abnett, “LNG Imports from Russia Rise.”
[31] Grünberger, “Which Russian Commodities Does the EU Still Import.”
[32] Gavin Maguire, “Europe Primed for Industrial Reboot after Key Power Price Deals,” Reuters, November 15, 2023, https://www.reuters.com/markets/commodities/europe-primed-industrial-reboot-after-key-power-price-deals-2023-11-14/.
[33] “The Cost of the Government’s Energy Support Policies,” Office for Budget Responsibility, October 2023, https://obr.uk/box/the-cost-of-the-governments-energy-support-policies/.
[34] Emter et al., “The Euro Area Current Account.”
[35] “Industry under Pressure.”
[36] “Industry under Pressure.”
[37] Emter et al., “The Euro Area Current Account.”
[38] Consilium, “Meeting Documents (Agendas, Minutes, Conclusions, Votes, Outcomes).”
[39] Kate Abnett, “Europe’s Spend on Energy Crisis Nears 800 Billion Euros,” Reuters, February 13, 2023, https://www.reuters.com/business/energy/europes-spend-energy-crisis-nears-800-billion-euros-2023-02-13/.
[40] Abnett, “Europe’s Spend on Energy Crisis.”
[41] Jeromin Zettelmeyer et al., “Beating the European Energy Crisis,” International Monetary Fund, December 2022, https://www.imf.org/en/publications/fandd/issues/2022/12/beating-the-european-energy-crisis-zettelmeyer.
[42] European Commission, Report from the Commission to the European Parliament, the Council, the European Economic and Social Committee and the Committee of the Regions: 2024 Report on Energy Subsidies in the EU (2025), https://eur-lex.europa.eu/legal-content/HU/ALL/?uri=CELEX:52025DC0017.
[43] “EU Trade Relations with Russia,” European Commission, November 27, 2024, https://policy.trade.ec.europa.eu/eu-trade-relationships-country-and-region/countries-and-regions/russia_en.
[44] “EU Trade Relations with Russia.”
[45] Alessandro Parodi et al., “Foreign Firms’ Losses from Exiting Russia Top $107 Billion,” Reuters, March 28, 2024, https://www.reuters.com/markets/europe/foreign-firms-losses-exiting-russia-top-107-billion-2024-03-28/.
[46] “Industrial Production Statistics,” Eurostat, July 2025, https://ec.europa.eu/eurostat/statistics-explained/index.php?title=Industrial_production_statistics.
[47] “Businesses in the Manufacturing Sector,” Eurostat, December 2025, https://ec.europa.eu/eurostat/statistics-explained/index.php?title=Businesses_in_the_manufacturing_sector.
[48] “National Accounts and GDP,” Eurostat, June 2025, https://ec.europa.eu/eurostat/statistics-explained/index.php?title=National_accounts_and_GDP.
[49] Emter et al., “The Euro Area Current Account.”
[50] Zettelmeyer et al., “Beating the European Energy Crisis.”
[51] “Energy Statistics – An Overview,” Eurostat, accessed December 10, 2025, https://ec.europa.eu/eurostat/statistics-explained/index.php?title=Energy_statistics_-_an_overview.
[52] “EU-Russia Trade at an All-Time Low, Imports Plummeted 86 per Cent since the Start of the War,” Eunews, May 21, 2025, https://www.eunews.it/en/2025/05/21/eu-russia-trade-at-an-all-time-low-imports-plummeted-86-per-cent-since-the-start-of-the-war/.
[53] “European LNG Tracker,” Institute for Energy Economics and Financial Analysis, October 2025, https://ieefa.org/european-lng-tracker.
[54] Chiacchio et al., “How Have Higher Energy Prices.”
[55] “European LNG Tracker.”