Connectivity Project by Philip Pilkington
The emerging field of geo-economics seeks to answer a long overdue question: To what extent does the economy play a role in the formation of geopolitical developments? This question is much more provocative than it first appears. When thought about in any depth, it can only surprise us that it was not posed long ago. The reason for this is twofold. First, since the emergence of industrial-scale warfare in the First World War, it has been obvious that robust economies are a fundamental requirement to win wars. While having a robust economy is not a sufficient condition to win an industrial-scale war, it is certainly a necessary condition. Without a robust industrial base, a country simply cannot produce enough materiel to fight a war on this scale.
While this is widely recognized by geopolitical thinkers, it has nevertheless generally been relegated to a place of secondary importance. Perhaps this was an acceptable oversight in a world where it could be readily assumed that most of the major powers had a solid military-industrial base, but the war in Ukraine has highlighted beyond any reasonable doubt that this can no longer be our baseline scenario assumption. Reports now reveal that Russia—which has an economy roughly the size of Germany’s—is producing three times more artillery shells than the entire European Union and the United States combined.
Second, and even more important, there is a distinct possibility that economic might is far more important than military might in our present world. Modern geopolitics was largely born in the nineteenth and early twentieth century. Those who developed the field had in mind the conflicts and changes in international power relations of the nineteenth century, when economic might did indeed play a secondary role in world affairs. But since the end of the Second World War—and arguably even since the end of the First World War—global power has been increasingly divided along economic rather than military lines.
This is obvious when looking at the post–Second World War settlement itself. Among the Western nations, the basic power relations were set wholly in line with relative economic power. The United States emerged from the war as the largest economy, and in financing the war, especially for Britain, it was able to take over the financial system in all the noncommunist countries through the Bretton Woods arrangements. This is the basic settlement we have lived with since. While the United States has been the major military power throughout this period, it is obvious that it is through its economic and financial might that it provides leadership rather than through its military might. America’s military might may backstop this arrangement, but it does not define it on a day-to-day basis—that is determined by American economic and financial power.
If this analysis is correct, then most practitioners of geopolitics have it backwards. Rather than assigning economics a secondary role in the formation of power relations on the international stage, it should be assigned a primary role. This has profound implications for geopolitical strategy. Take a simple example: the trade-off between having a large army and deploying the cost of the large army to develop a country’s economy. This is exactly the trade-off that is facing Europe as it contemplates rearming at the time of writing. If it is true that economic power trumps military power in terms of establishing a country or a region’s international influence, then it is not clear if it is always wise to expend resources on rearmament if the economy of that country or region might suffer greatly as a result. This is confirmed if we look at the countries that spend the most on their military relative to their economy. If we exclude Ukraine due to its war spending, the top ten countries in terms of military expenditure as a percent of GDP contain only three high-income countries: Israel, Greece and the United States. Of the other seven, the only two that stand out in terms of global influence are Russia and Saudi Arabia. It is very notable that China does not even appear on the list. Excluding Ukraine, China is twenty-second on the list of countries that spend the most money on their military relative to their total economy. These figures confirm the intuition: simply spending resources on a country’s military does not determine that country’s standing on the world stage.
These observations open a potentially enormous field of study. In the following paper, we will focus in on a more modest goal: We will look at how the NATO alliance looks relative to the BRICS+ in terms of its economy. NATO is typically thought of as a military alliance and examined in terms of its military capacities. But if the preceding argument is correct, it is also fruitful to understand how economically powerful NATO is relative to its potential rival in the BRICS+. The economic strength of the NATO countries undergirds their military strength, and it is important to track the global standing of the alliance’s economic compacity. This study does not assume that the BRICS+ countries would cohere as a military alliance, but many of their members are militarily related (e.g., Russia and China), and the exercise is important for understanding NATO countries’ economic strengths and weaknesses. Doing so should allow us to better understand both NATO’s relative economic power in the world and its capacity to marshal resources in the event of a potential war scenario.
Economic Size
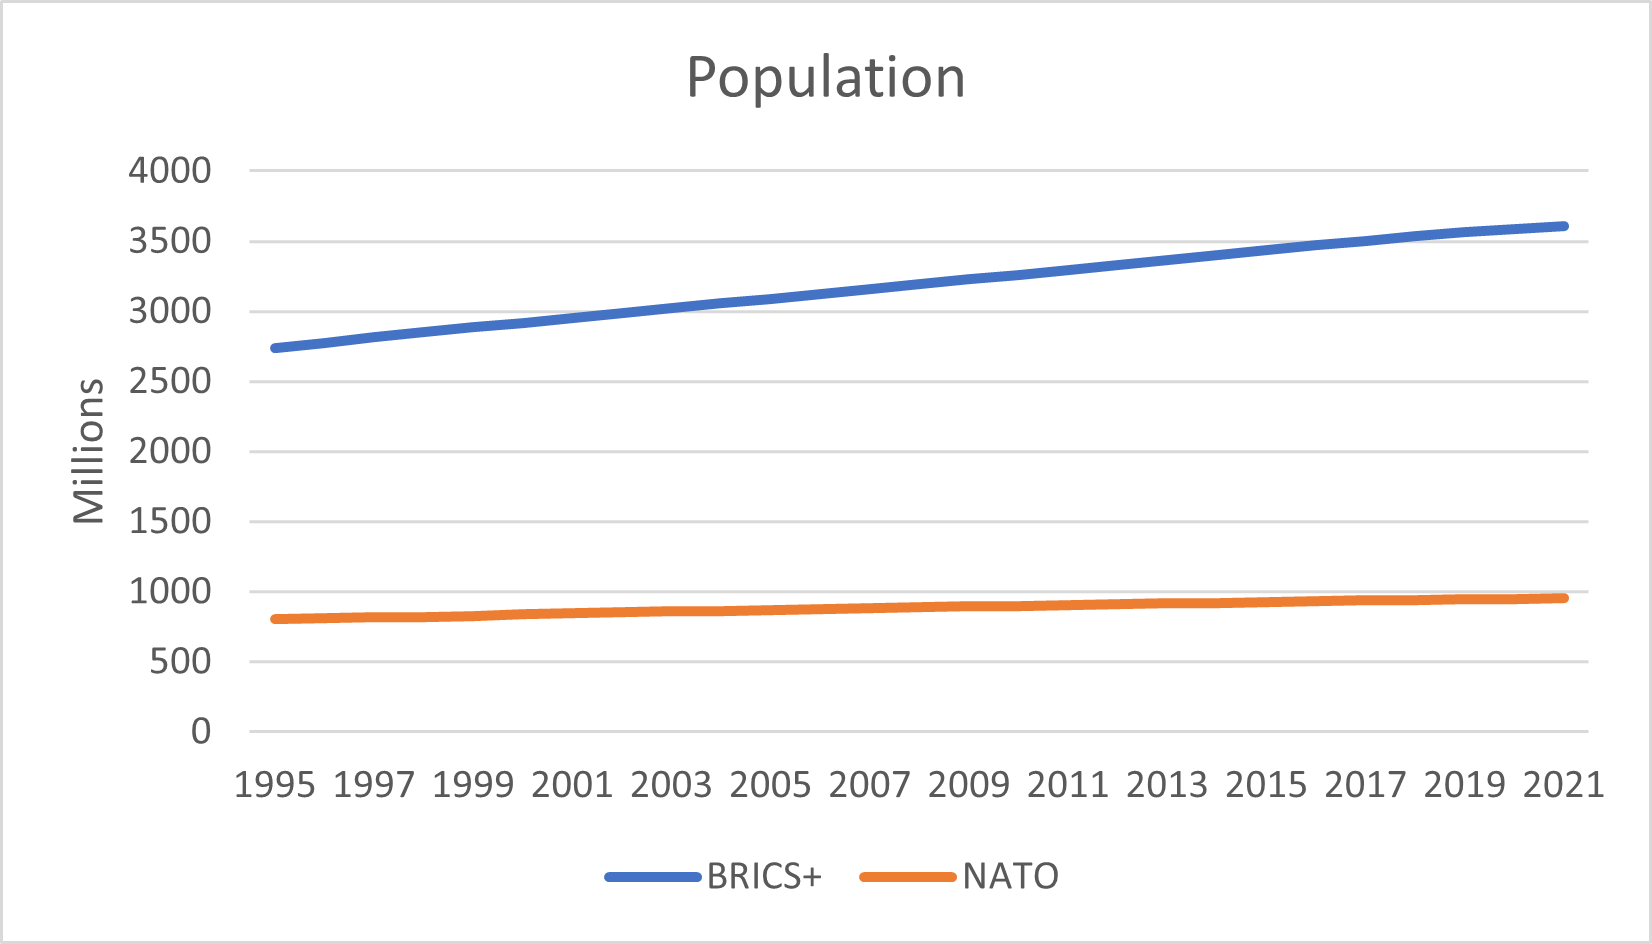
To contextualize the findings, it is necessary to first understand the basic demographics of the NATO countries and the BRICS+ countries. The combined BRICS+ countries are orders of magnitude larger in terms of population than the combined NATO countries and are getting more so as time goes on. Despite NATO having thirty countries as members and the BRICS+ only having nine countries as members, in 2021 the BRICS+ had a population roughly 3.8 times larger than NATO. This gap has been widening over time, with the BRICS+ having only 3.4 times the population of the NATO countries in 1995. Looked at in a different way, the average NATO country in 2021 had around 31.7 million residents while the average BRICS+ country had around 401 million residents. These massive discrepancies in populations will prove important in the analysis that follows, but for now it is worth noting that even if we assume a similar age structure in the relative populations of the two groupings, the BRICS+ grouping would have an enormous manpower advantage against the NATO grouping.
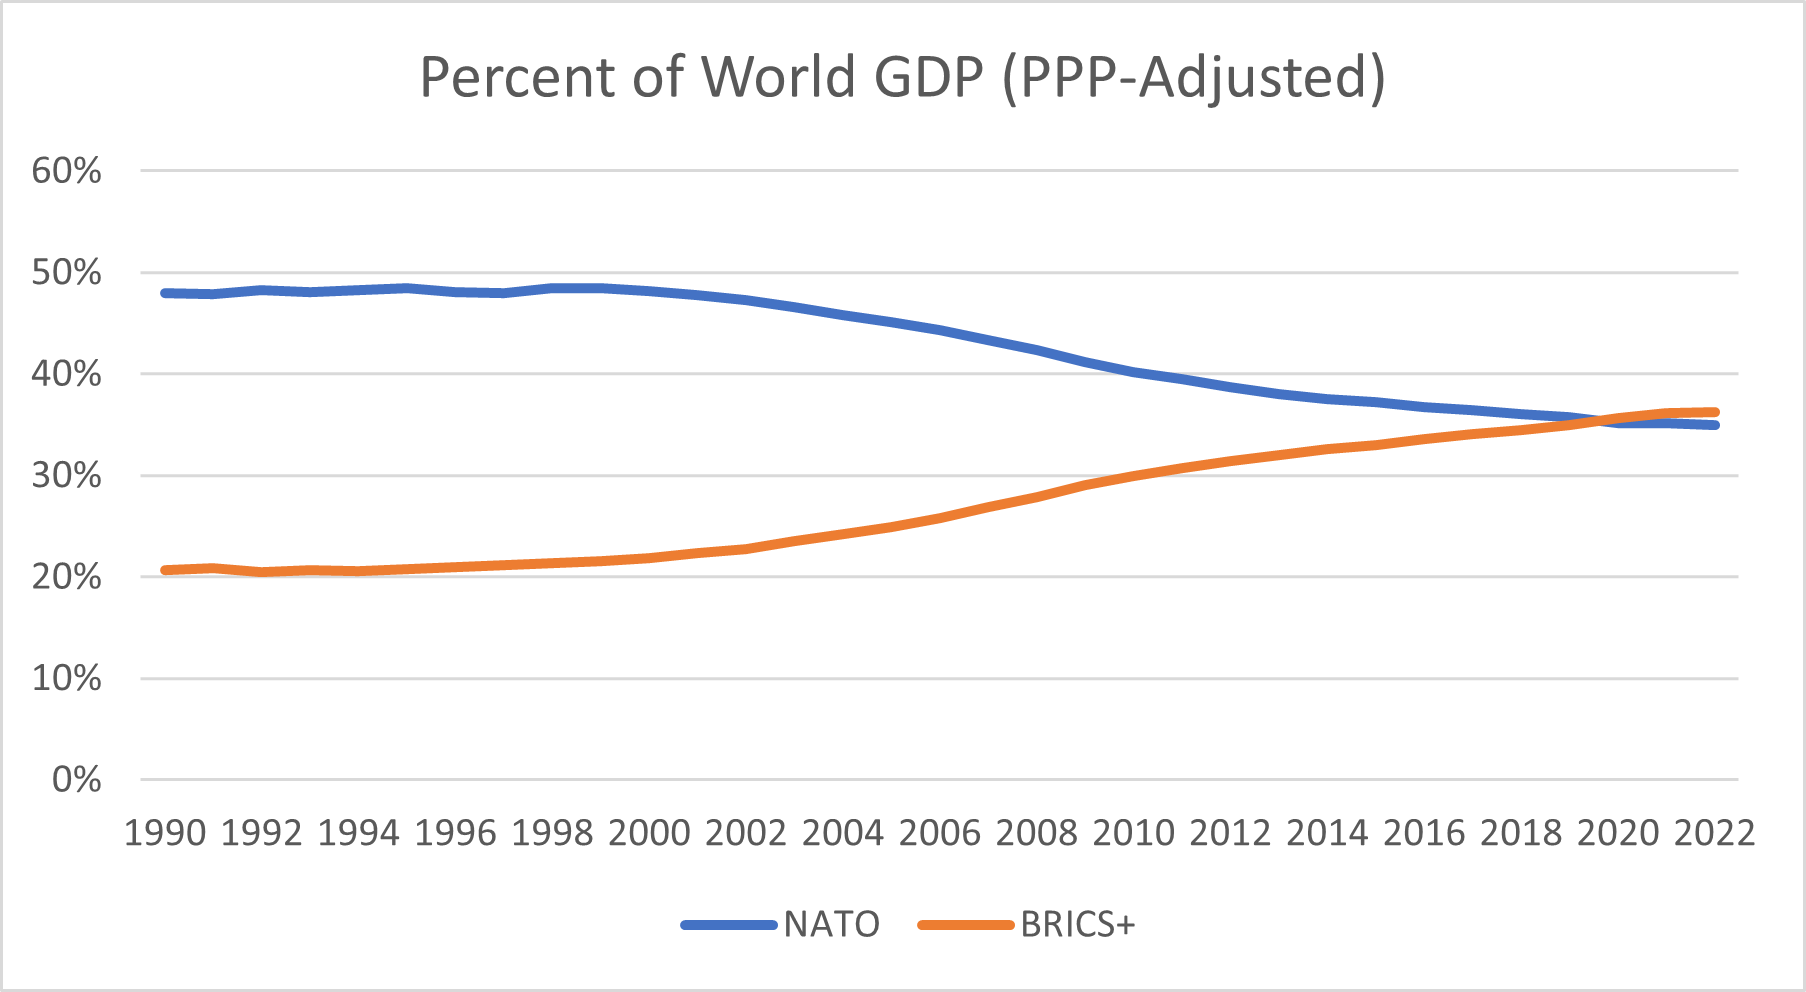
The first economic metric that we will look at is PPP-adjusted GDP. This is the correct metric to use when comparing the relative wealth of countries internationally. Here we see that there have been enormous changes in the past three decades. In 1990, NATO countries comprised around 48 percent of world GDP but since then have slipped to around 36 percent of world GDP. Meanwhile, in 1990, the BRICS+ countries comprised around 21 percent of world GDP but have since increased to around 36 percent. In just thirty years, the BRICS+ grouping has gone from having economies less than half the size of the economies of the NATO countries to having economies of equal size. While this is a relatively recent development, it is not completely new: the two groupings’ economies have largely converged in the past five years or so.
Next, we will look at contributions to global economic growth. Here we see that NATO made up a larger share of global economic growth until the beginning of the 2000s. This is likely the result of the petering out of the 1990s dot-com boom that took place under the tutelage of the Clinton administration in the United States. It came to an end in 2000 when the stock market experienced its biggest collapse in recorded history. Meanwhile, BRICS+ countries really come into their own in the mid-2000s. Between 2004 and 2007, NATO countries contributed around 1.4 percent to global annual GDP growth while the BRICS+ countries contributed around 2.1 percent. But the situation changes dramatically after the world starts to recover from the global financial crisis of 2008. Between 2009 and 2021, NATO countries contribute only 0.6 percent to global annual GDP growth while BRICS+ countries contribute 1.6 percent. It is after the 2008 financial crisis that NATO countries slip into relative stagnation while BRICS+ countries, though their growth rate slows somewhat, continue to contribute to world growth.

Next, we will look at the NATO grouping itself to see if it has changed a great deal over time. In a previous paper, we looked at the changing nature of the BRICS+ grouping over time. We saw that there have been enormous changes in the country structure of the BRICS+ grouping over time. The following chart shows that this is not the case with the NATO grouping. Since 1990, the share of total GDP by country appears to have barely changed at all except for one country, Türkiye, which has substantially increased its share, rising from 2.8 percent of NATO GDP to 5.8 percent. Türkiye is the only emerging market in the NATO grouping. This leads to the conclusion that the developed economies of the NATO bloc are both slower growing than the emerging markets of the BRICS+ bloc and also more static in terms of their development.

Commodity Production
Recent developments have led some to question the wisdom of using simple GDP metrics to try to gauge relative economic size and importance. Issues with using GDP metrics came clearly into view with the failure of the Western sanctions to have much of an impact on the Russian economy—an issue that we have addressed in past work. “Simple GDP statistics have arguably lulled the West into a false sense of security,” the French economist Jacques Sapir writes in an excellent survey of these problems. “By GDP, Western economies appear dominant and their capacity to impose sanctions decisive. But the West’s reliance on service sectors—and the relative weakness of directly productive sectors like manufacturing, mining, and agriculture—introduces critical vulnerabilities in goods production and supply chains.”
Since we are discussing the relationship between the economy and potential military alliances, it seems advisable that we should examine the access various groupings have to the raw materials needed, not just for economic growth and development, but also for warfare. Developments in the global steel markets since the late-1960s have been profound. In 1967, the NATO grouping produced around 10.6 times as much steel as the BRICS+ grouping. In 2023, however, the BRICS+ grouping produced around 5.5 times as much steel as the Western grouping. It is also notable that BRICS+ steel production has been rising over time, while NATO steel production has either stayed stagnant or even fallen slightly. Based on this data, in any war scenario, BRICS+ would have an enormous advantage, not just in terms of keeping their economies supplied with steel, but also in terms of making the materiel needed to fight a large-scale war.

Next, we will look at per capita steel production, recalling that the BRICS+ grouping has a far larger population than the NATO grouping. Here we see enormous changes since 2000. In 2000, the NATO grouping produced roughly 4.2 times as much steel per person as the BRICS+ group, while in 2021 the BRICS+ grouping produced around 23 percent more steel per head than the NATO grouping. We would argue, however, that the correct metric to look at is overall steel production both in economic terms and in terms of war. In economic terms, it is important to note that despite the BRICS+ countries having a much larger population, lower levels of development mean that the average person living in the BRICS+ requires less steel to meet their consumption needs than the average person living in the NATO grouping. In terms of warfare, we might think of steel as the potential military production each side could undertake. Since the BRICS+ countries have a larger amount of steel, this means that they should be able to produce more materiel, giving them the advantage.

Next, we will look at oil production. It barely needs to be said that oil is the most important input, after labor, in any modern economy. In military terms, oil is arguably less important than steel, but it comes in a close second. It is conceivable that troops could be deployed with firearms and even anti-tank and anti-air weapons by a country with access to steel but no access to oil. Mechanized warfare, on the other hand, is impossible without access to oil.
Unsurprisingly, BRICS+ countries produce significantly more oil than the NATO countries. Up until 2011, this gap was widening. In 1995 the BRICS+ grouping produced around 63 percent more oil than the NATO grouping, while in 2011 they produced around 2.6 times more oil. This has changed substantially since the fracking revolution allowed NATO countries, especially the United States, to drastically increase its oil production. In 2022, the BRICS+ were back to producing around 63 percent more oil than NATO. It now seems likely, however, that the gap will continue to grow once again.
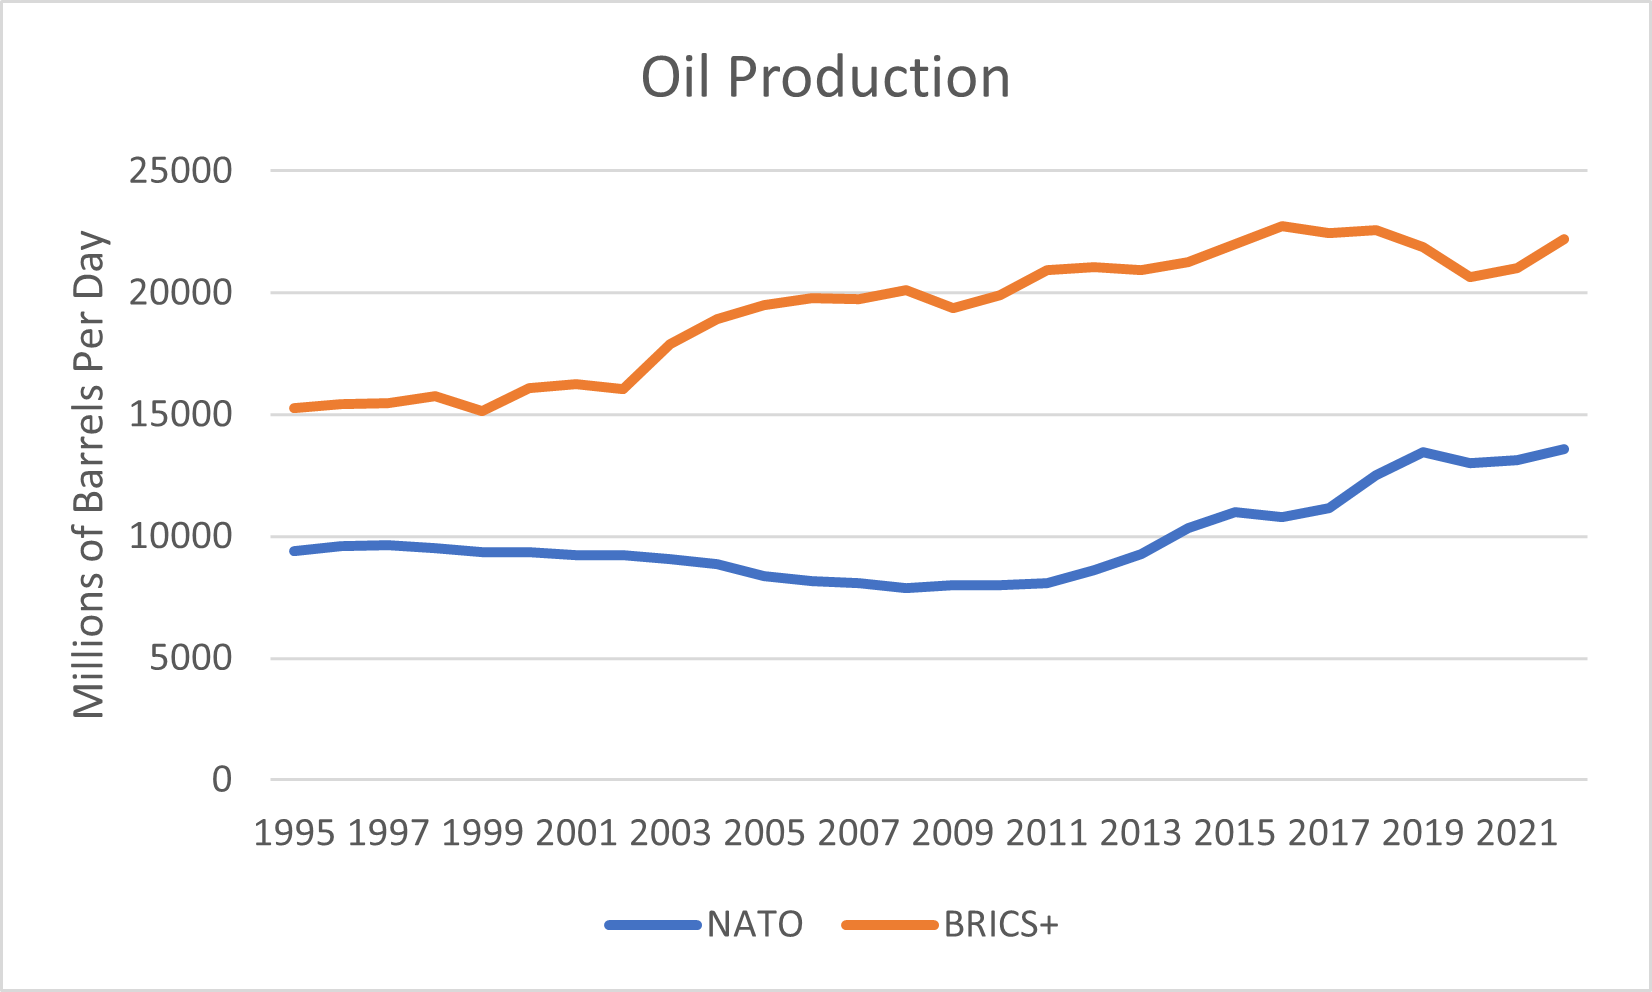
As can be seen from the data, the fracking revolution ended around 2019 when the new technology had been fully deployed in the United States. There may be some uptick in usage of the new technology among NATO members outside of the United States in the future, but this will likely not make an enormous difference. Meanwhile, it seems plausible that the BRICS+ countries can continue to raise their oil production capacities as they further develop their economies and produce more oil. This implies that although the United States is currently energy independent thanks to the fracking revolution, if its economy continues to grow, its energy needs will not be met by domestic supply, and they may once more find themselves reliant on the BRICS+ grouping for oil supply at the margin.
When we turn to oil production per capita, a different picture emerges. NATO has consistently higher oil production per capita than the BRICS+ countries. This is due, as we have seen with the case of steel, to the enormous population advantage possessed by the BRICS+ countries. Yet although NATO has superior oil production per capita, this has fluctuated through time. In 1995, OPEC produced about 2.1 times more oil per capita than the BRICS+ countries. This fell substantially, and by 2011, OPEC only produced about 1.4 times as much oil per capita as BRICS+. But the fracking revolution saved the day and in 2021, NATO produced around 2.4 times as much oil per capita as the BRICS+—a higher per capita production differential than in 1995.

As with steel, however, raw per capita metrics are misleading. This is because, being poorer, the average resident of the BRICS+ grouping needs less oil supply because they consume less. As these countries develop, they will no doubt consume more oil, but we might also assume that they will also explore and develop new oil fields and so the net effect of development is unknown. This is another way of saying that the BRICS+ grouping is a net oil exporter. This can be seen clearly if we compare NATO and BRICS+ oil production and consumption. When we do this, we see that NATO and BRICS+ consume relatively similar amounts of oil but BRICS+ produces a lot more. BRICS+ is roughly balanced in terms of production and consumption, but NATO is not. We can also see these dynamics at work if we adjust consumption and production for relative population.
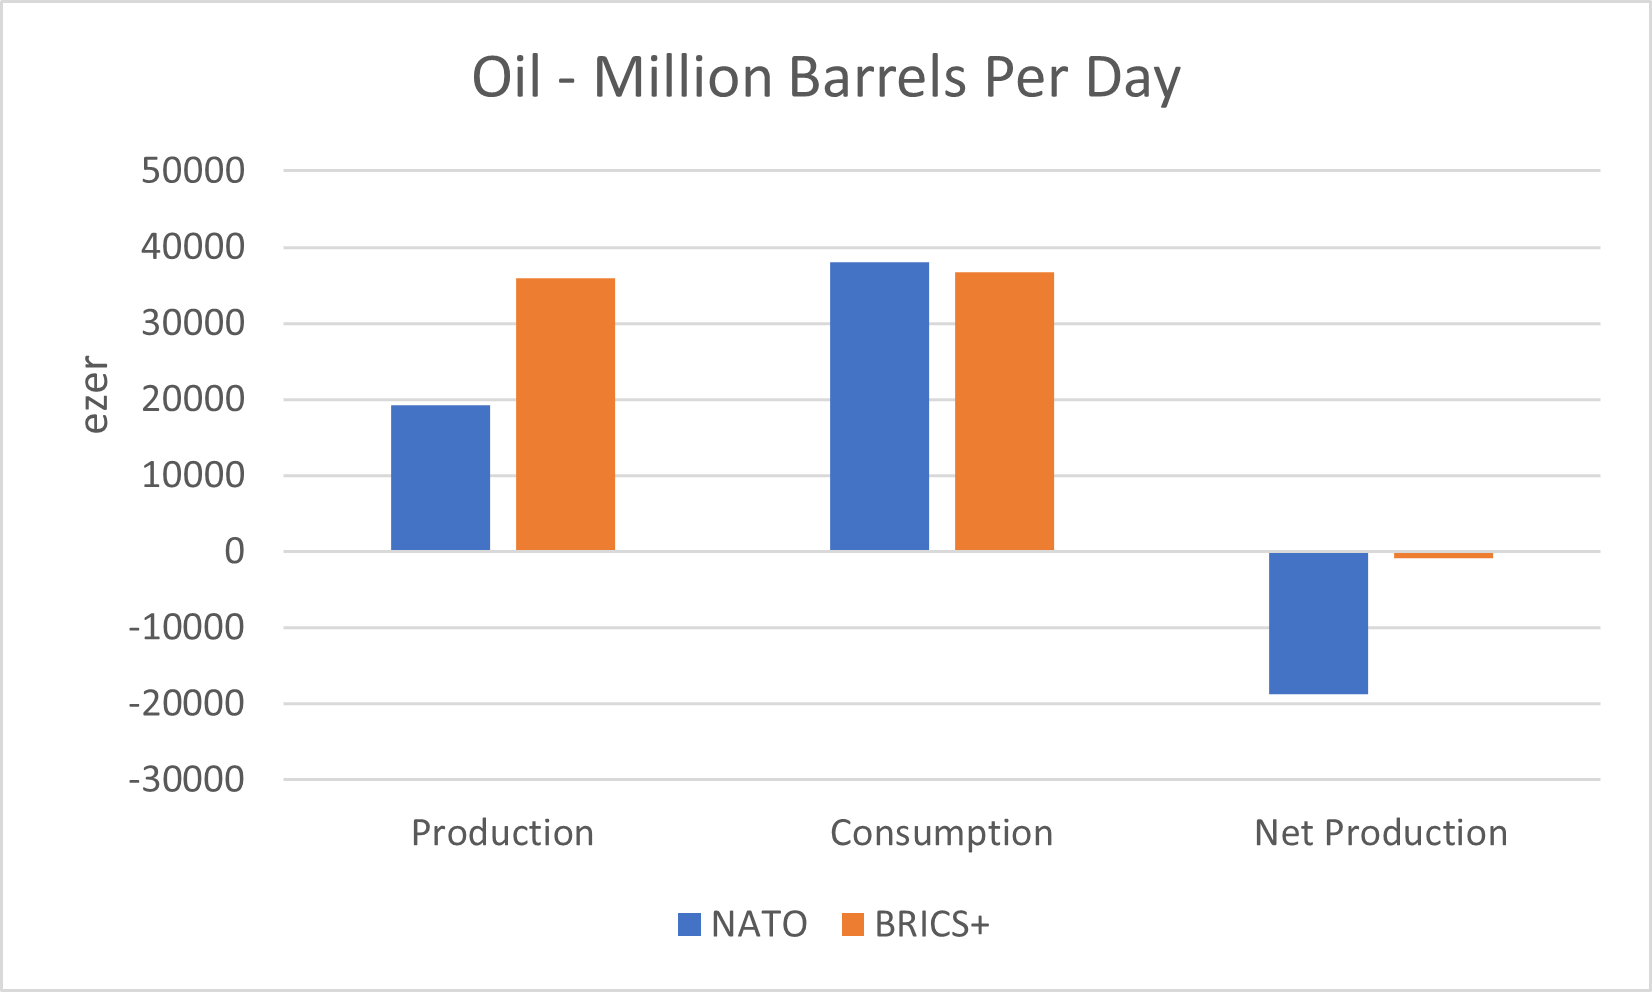
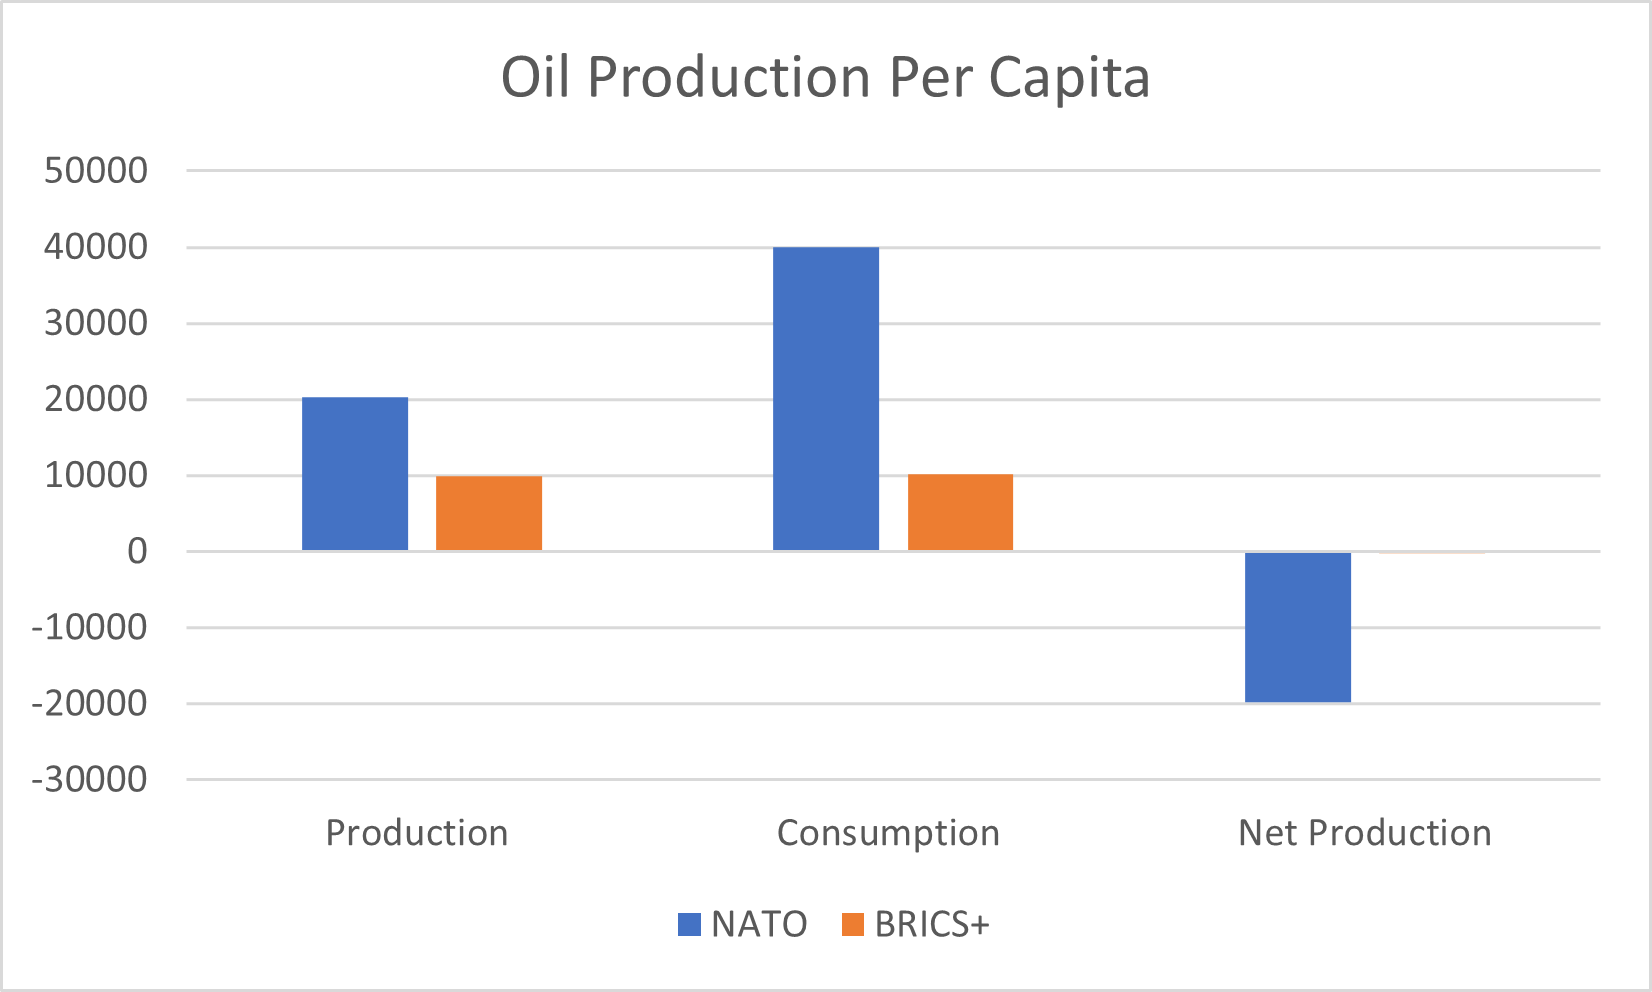
We might summarize these findings by saying that BRICS+ produces substantially more oil than NATO but also has a much larger population. Nevertheless, the average resident of the BRICS+ consumes a lot less oil and so their production and consumption are roughly balanced. NATO, on the other hand, runs a large production deficit due to its extremely high rates of consumption—this translates into net oil imports. In the event of a conflict, therefore, the BRICS+ would have the advantage because they are effectively independent in terms of their oil supply. NATO, on the other hand, is not independent and would therefore have to either cut consumption drastically—difficult in a situation of conflict—or they would have to try to continue importing oil from elsewhere which may be tough in a conflict situation.
Next, we will look at the production of cereals like wheat, rice and corn. We use this as a proxy for total food production, figures for which are extremely difficult to access. Cereals are one of the most basic components of food production and so should provide a reasonable proxy for total food production. When it comes to raw production of cereals, the BRICS+ countries appear to have two advantages. First, they produce more cereal than the NATO countries. Second, they appear to be growing their food production while NATO food production stagnates. In 1995, the BRICS+ grouping produced only 32 percent more cereal than the NATO grouping, but in 2021 it produced around 58 percent more.

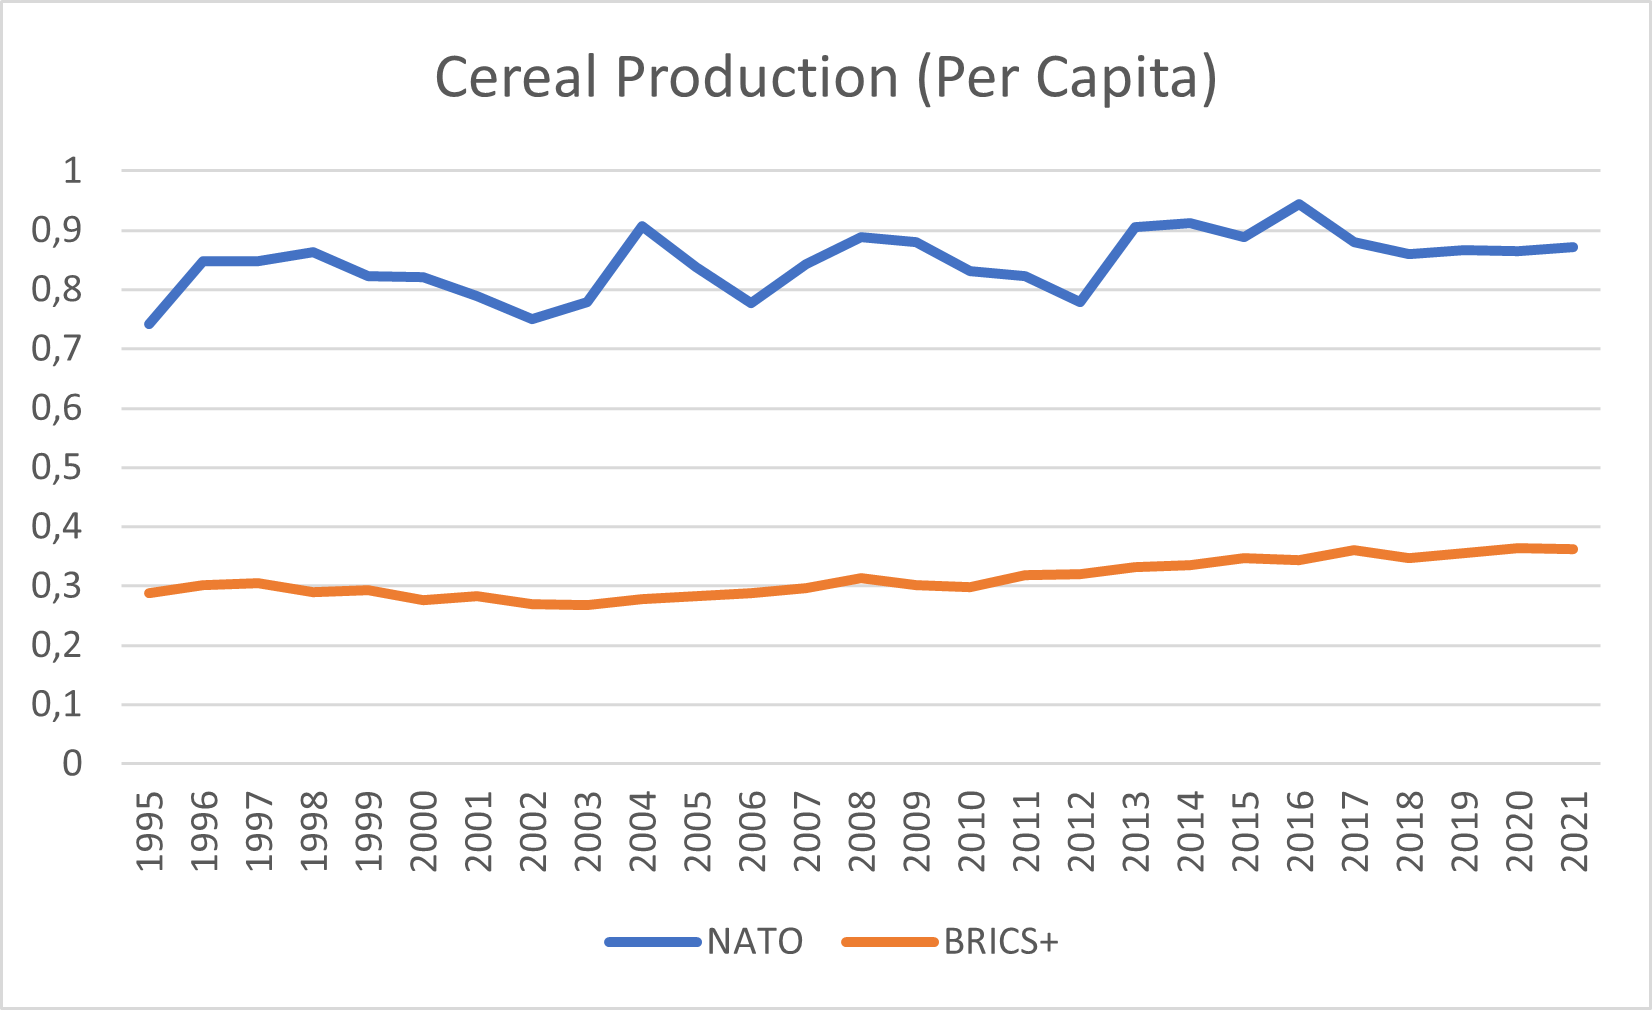
Yet this picture changes substantially when we look at cereal production per capita. Here, NATO countries have an enormous advantage. In 2021, NATO produced around 2.4 times as much food per person than the BRICS+ countries. This fits with intuition: while many of the BRICS+ countries, like Russia and China, do not suffer from food shortages, others, like Egypt and India, occasionally do. We also see that food production per capita in both groupings is relatively stagnant. This implies that the increased food production growth that we saw in the BRICS+ grouping in overall tonnage was mainly a function of population growth. Again, BRICS+ countries are poorer, and so they tend to consume less food, but nevertheless out of all the metrics that we looked at the BRICS+ main disadvantage relative to NATO is in terms of food production. NATO is food secure, BRICS+ is less obviously so.
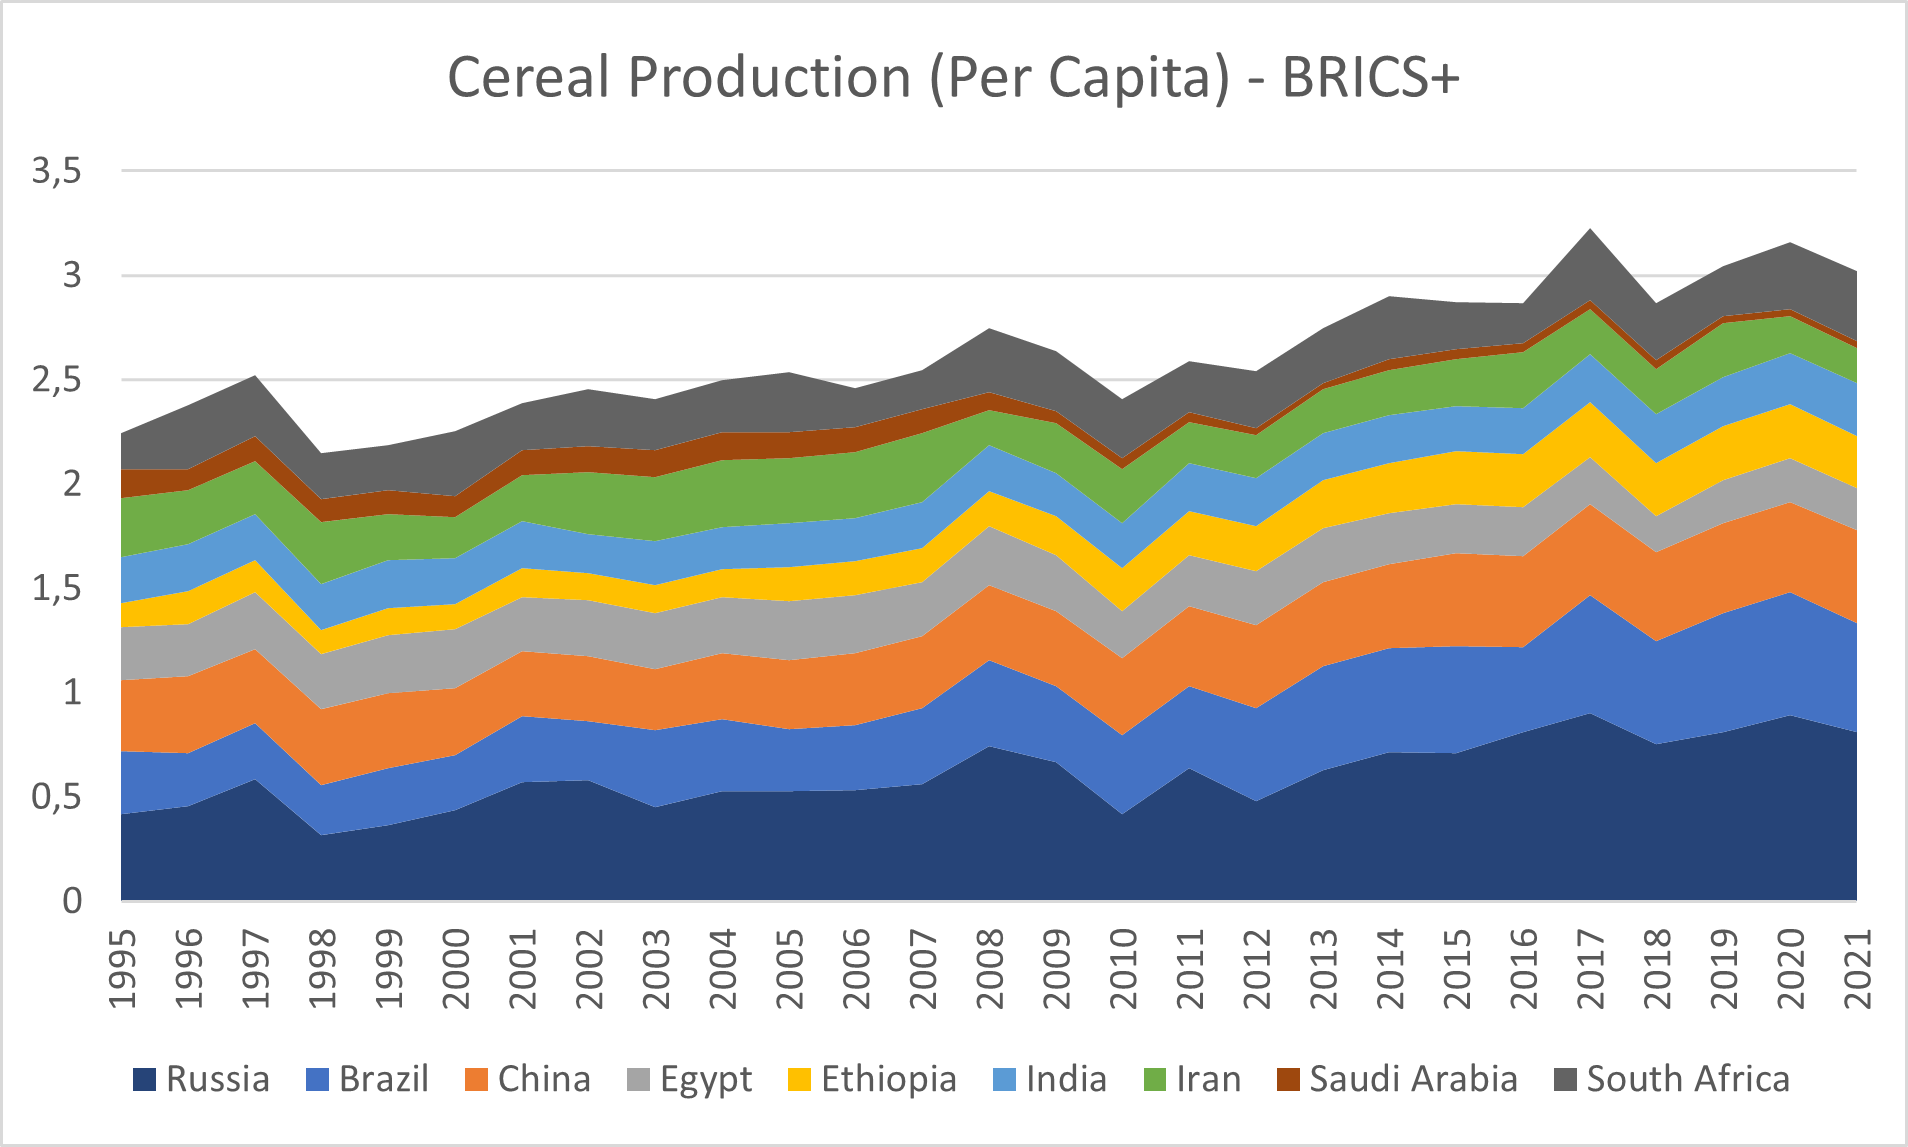
Because food production is clearly an issue for the BRICS+ countries, it is worth examining at a country level which countries are growing their cereal production per capita more rapidly than others. The standout country here is Russia, whose cereal production per capita has increased around 94 percent between 1995 and 2021. For context, the average increase amongst the rest of the countries over this time was around 24 percent, while China increased its production per capita by around 30 percent. This raises the prospect that Russia might move to become a more important food exporter as the BRICS+ grouping develops economically. The data certainly suggests that this is a potential comparative advantage for the country in the grouping.
Conclusion
The economy plays a crucial role in shaping geopolitics, and this is especially clear in today’s world, where it can no longer be assumed that all major powers have a solid military-industrial base. Given that larger economies seem to have more power on the international stage, it may even be true that economic might has become more important than military might. Based on these observations, this paper set out to examine the NATO alliance’s relative economic power compared to the BRICS+ cooperation format, to understand how the economies of the NATO alliance stack up in the global power competition. To do so, we compared the groupings’ economic size and examined the production of three specific commodities: steel, oil and cereal.
There is a notable demographic difference between NATO and BRICS+ countries. The BRICS+ countries have significantly larger populations, and this disparity will only continue to grow as fertility rates in the West decline. These population differences have an impact on economic capacity and military capabilities. Moreover, BRICS+ countries now account for a larger portion of PPP-adjusted world GDP and are experiencing more GDP growth than the NATO countries.
GDP metrics, though, do not always provide an accurate picture of economic capacity, so we also looked at the production of commodities. Steel, oil and food are all important for warfare. While steel production used to be higher in the NATO countries, the BRICS+ countries now produce significantly more. The picture is more complicated when looking at per capita steel production, since the BRICS+ grouping has a significantly larger population, but BRICS+ has still had higher steel production per capita since around 2015. Plus, the BRICS+ populations use less steel given their countries’ lower levels of development. In terms of oil, BRICS+ countries produce more and consume less than those in the NATO alliance, although they produce less per capita. NATO is a net oil importer, while BRICS+ produces about the same amount of oil as it uses. Finally, we turned to food production. BRICS+ produces more cereals overall, but NATO produces significantly more per capita. NATO is food secure, while BRICS+ is not.
To improve the alliance’s defensive might on the global stage, NATO countries would be well advised to prioritize economic growth and the production of steel and oil. While NATO is already ahead on food production, it should continue maintaining this level. Hungary is already on track to meet these objectives with its family policy, connectivity strategy, reindustrialization efforts and protections for local food industries, meaning it is well positioned to take on the geopolitical security challenges of the future.
Published on July 10, 2024.
