Is Trump’s Trade Policy Working?

Perspective – Written by Philip Pilkington
The full analysis is available here.
The recent release of data for the United States trade balance has surprised some observers. The October data shows a significant rebalancing of American trade with the rest of the world, leading some to wonder if the Trump administration’s tariff policy might be more effective than it was thought to be after many of the tariffs were renegotiated. In this paper, we will explore what the drivers of trade rebalancing are, whether they are caused by the tariff policy and whether they are sustainable.
Let us start with the trade balance overall. As Figure 1 shows, the September trade deficit was basically in line with the trade balance prior to the tariff shock in the first and second quarters of 2025 when there was a surge in imports as businesses quickly built inventory to avoid the tariffs. In October, however, we see the trade deficit fall substantially below previous trend levels. We also see that this is due to a sharp decline in the trade deficits in goods. The trade surplus in services has remained constant throughout the period of the tariffs shock.
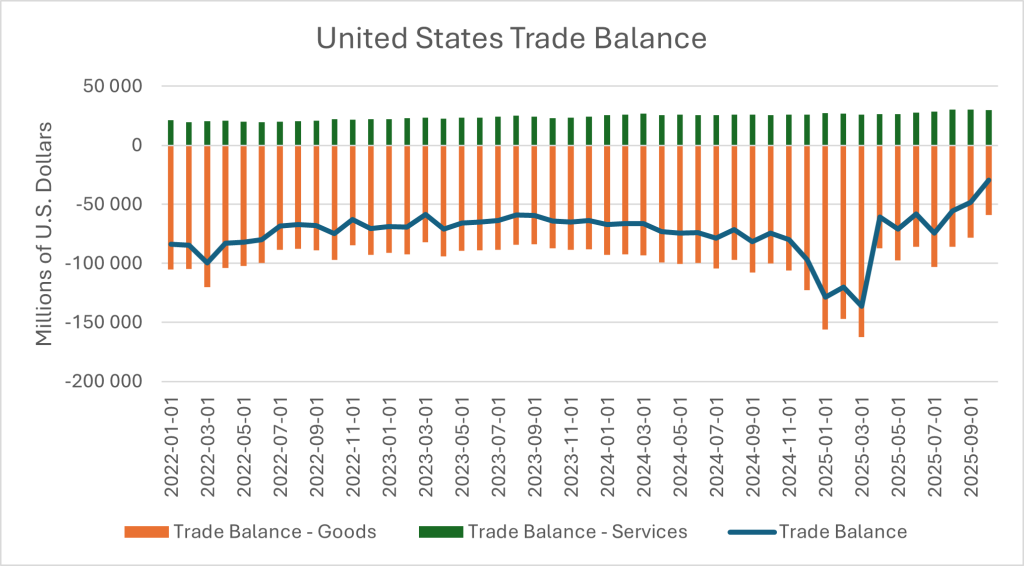
Figure 1. United States Trade Balance. Data Source: U.S. Bureau of Economic Statistics.
This improvement in the American trade balance looks even more dramatic if we look at it as a share of GDP. Table 1 shows both the overall trade balance and the balance in goods trade in October 2022, long before the tariffs were put in place and before it was even clear that Trump would become president, and the balances in October 2025. The trade deficit overall has more than halved and the balance in goods trade has fallen by just under half. These are enormous changes.
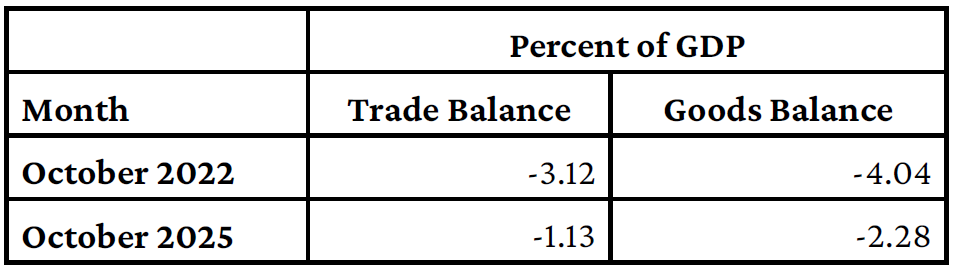
Table 1. United States Trade Balance and Balance in Goods Trade as a Percent of GDP. Data Source: U.S. Bureau of Economic Statistics.
To understand better what is driving these changes, we will look at the specific categories that are being most impacted. Table 2 below shows every category that fell by $1 billion or more between October 2024 and October 2025. Here the most notable standout is “pharmaceutical preparations” which fell by nearly $8 billion, more than double the next largest category, “passenger cars.” “Pharmaceutical preparations” covers everything from finished pharmaceuticals to chemicals that are imported and finished into pharmaceutical products over time.
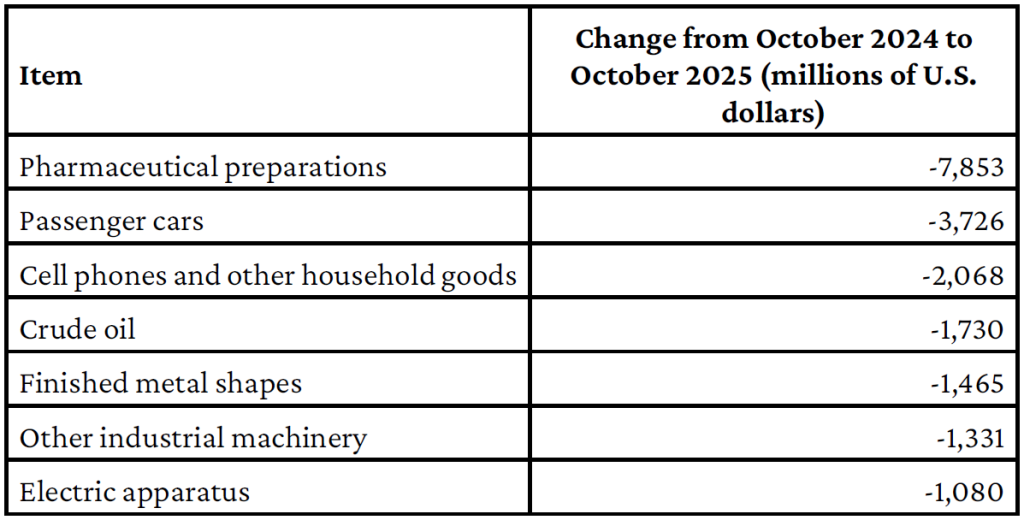
Table 2. Categories That Fell by $1 Billion or More Between October 2024 and October 2025. Data Source: U.S. Bureau of Economic Statistics.
This raises the prospect that these products were imported in enormous volumes before the tariffs were introduced in April 2025 and stockpiled. The extremely large decline that we see in October could be the retailers selling down these stockpiles. This could be the case with some of the other products too. The peak of the inventory buildup in 2025 was in March. Table 3 shows year-to-date imports of these product categories in March 2025 compared to year-to-date figures from March 2024. Here we see that two products stand out: “pharmaceutical preparations” and “finished metal shapes,” imports of both these categories soared in anticipation of the tariffs.
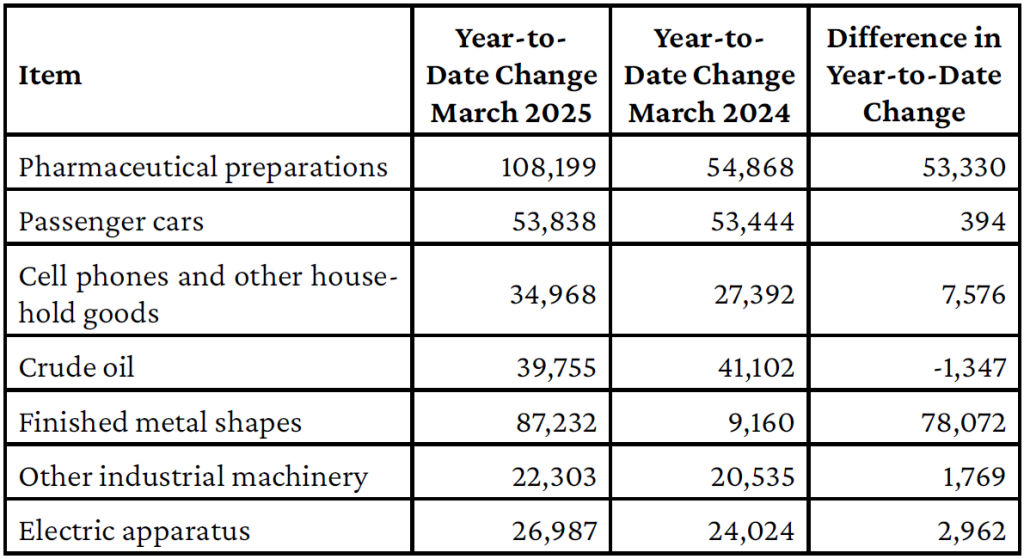
Table 3. Year-to-Date Imports of These Categories of Products in March 2025 Compared to Year-to-Date Figures from March 2024 in Millions of U.S. Dollars. Data Source: U.S. Bureau of Economic Statistics.
It appears that two types of categories account for the improvement in the trade balance. In one category, we have imports of goods that are declining without previous inventory buildup. In the other, we have goods that are declining due to previous inventory buildup. Figure 2 shows the most dramatic examples of the second category.
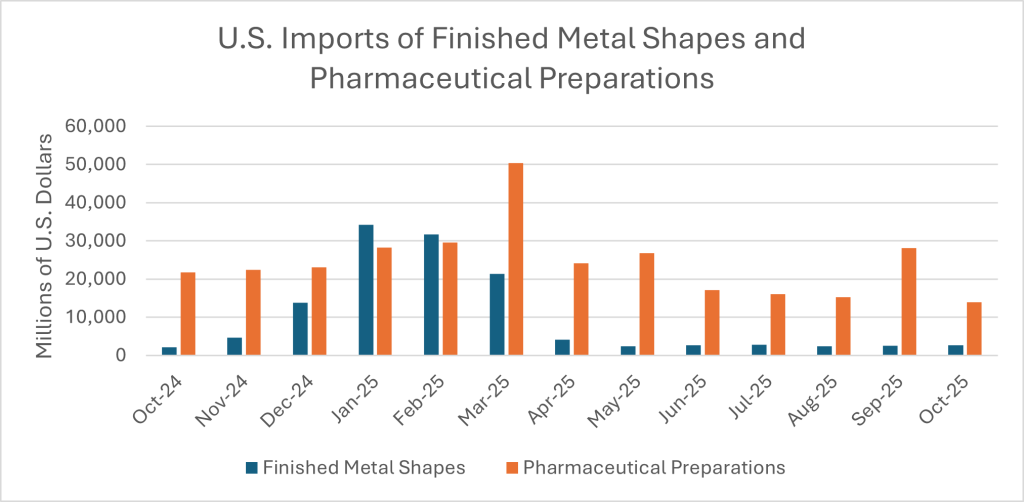
Figure 2. U.S. Imports of Finished Metal Shapes and Pharmaceutical Preparations. Data Source: U.S. Bureau of Economic Statistics.
The question is how much of the decline in the American trade deficit is being driven by firms curtailing imports because they built up substantial inventories before the tariffs were put in place. As of now, it is impossible to tell. We can certainly say that some of the decline in the American trade deficit is due to these tariff-induced inventory dynamics, but we cannot say with confidence that all of it is. We will have to wait and see over the long term whether the American trade deficit remains permanently lower or whether it goes through a brief period when these inventories are being run down and then reverts to its previous levels.
Next, we will look at what the geographic data is telling us about the impact of the tariffs. Table 4 shows the major developments in the geographic data so far. These are the four countries/regions that have seen the biggest change in the past year.
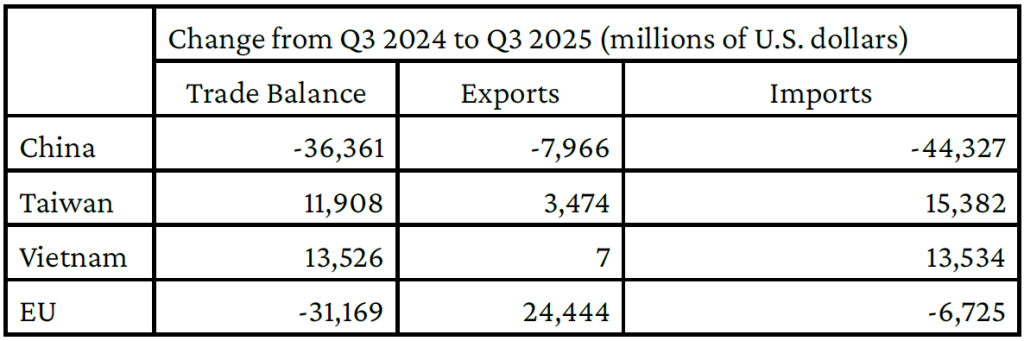
Table 4. Changes in Exports, Imports and the Overall Trade Balance between Q3 2024 and Q3 2025 for China, Taiwan, Vietnam and the EU. Data Source: U.S. Bureau of Economic Statistics.
When it comes to China, we have seen an enormous decline in Chinese imports to the United States. The question is whether some of these are just being “reexported” through other countries. That is, whether China are just sending these products as components to other countries where they are turned into final products and shipped to the United States. The fact that the United States has seen a large increase in imports from Vietnam should make us cautious that this may be the case. It is well known that in the past Vietnam has been a hub for Chinese “reexporting.” Yet the increase in Vietnamese imports accounts for less than a third of the fall in Chinese imports.
The question is whether the increase in Taiwanese imports is another example of “reexporting.” Reports in the business press claim that this increase in imports from Taiwan is being driven by the AI boom and the need for semiconductors. We do not have sufficient data to explore this, but it should be a focal point for further research. We can say, however, that Taiwanese imports from China have only risen modestly, from $6.12 billion in October 2024 to $7.56 billion in October 2025, while exports to the United States rose from $10.7 billion to $22.25 billion in October 2025. This suggests that the Taiwanese export boom to the United States is not a case of reexporting.
Finally, there is the case of the European Union. We have seen an enormous increase in exports from the United States to the European Union. What accounts for this? It appears that this is only tangentially related to the trade war. The main driver of this increase in exports seems to be the energy situation in Europe. Because of the lack of access to Russian piped gas, the European Union has been forced to increase its LNG purchases from the United States. This leads to higher export volumes from the United States to the European Union in the first order. In the second order, European industry becomes less viable due to the higher energy prices associated with LNG. This leads to the European Union having to increase imports from the United States in sectors that are energy intensive, like chemicals. In short, the improved trade balance that the United States has seen with the European Union this year is due to the energy crisis in Europe and the deindustrialization of the continent.
On balance, there is some evidence that the Trump administration’s trade policy is having an effect. Some of this effect is likely impermanent and due to inventory buildup prior to the tariffs. These impacts will prove fleeting. But some of the effect looks like it may have more permanence. We will not be able to fully evaluate the magnitudes for some time though, probably later in the year. In terms of its geographic impact, there is some indication that it is leading to an improvement in the trade balance with China. Whether this is a case of Chinese goods being reexported through other countries needs to be explored further, but provisional evidence suggests that at least some of it is not reexport. Whether this decline in imports from China will have a positive or negative impact on American productive capacities moving into the future will not be clear for a long time, however. Overall, we can say that there is evidence that the Trump administration’s policies might be working, but probably more modestly than headline trade deficit numbers might lead us to believe.